Download
1 / 16
160 likes | 273 Views
This presentation explores the challenges and solutions for visualizing multidimensional data across various fields, including demographics, economics, and health. Traditional visualization methods struggle with complexity, making outlier detection and relationship understanding difficult. We introduce a Rank-by-Feature approach that allows users to interactively examine projections of high-dimensional data in an orderly fashion. By defining ranking criteria for both 1D and 2D projections, users can efficiently identify patterns, gaps, and outliers, enhancing their data analysis experience.

E N D
Interactive Exploration of Multidimensional Data By: Sanket Sinha Nitin Madnani
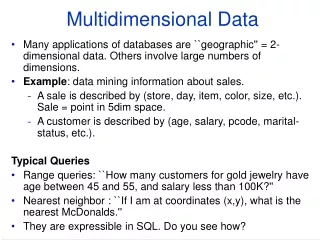
Is It Really That Common ? • You Bet: • Demographics • Economics • Census • Microarray Gene Expression • Engineering • Psychology • Health
I can’t see it, I tell ya ! • Visualization challenges for >= 3D: • Relationship comprehension is difficult • Discovering outliers, clusters and gaps is almost impossible • Orderly exploration is not possible with standard visualization systems • Navigation is cognitively onerous and disorienting (3D) • Occlusion (3D)
1D : Histograms 2D : Scatterplots Standard Solution • Can you say “Pro-jek-shun” ? • Use lower dimensional projections of data:
But there are so many ! • For 13 dimensions (columns) : • Number of histograms = 13 • Number of scatterplots = C(13,2) = 78 • Must examine a series of these to gain insights • Unsystematic == Inefficient • Must have order !
Introducing Rank-by-feature • Allows projections to be examined in an orderly fashion • A powerful framework for interactive detection of: • Inter-dimension relationships • Gaps • Outliers • Patterns
How does it work ? • Framework defines ranking criteria for 1D & 2D projections • User selects criterion of interest • All projections are scored on the criterion and ranked • User examines projections in the order recommended • Eureka* !! *Disclaimer: All users may not be able to make life-altering discoveries
Ranking Criteria - 1D • Normality: Indicative of how “Gaussian” the dataset is • Uniformity: How “uniform” is the dataset ?(How high is the entropy ?) • Outliers: The number of potential outliers in the dataset • Gap: The size of the biggest gap • Uniqueness: Number of unique data points
Ranking Criteria - 2D • Linear Correlation: Pearson’s correlation coefficient • LSE: Least Square Error from the optimal quadratic curve fit • Quadracity: Quadratic coefficient from fitting curve equation • Uniformity: Joint entropy • ROI: Number of items in a Region Of Interest • Outliers: Number of potential outliers
The Input Dialog Box Perform Filtering & Normalization
Tabular View of Data Select specific data records and annotate if needed
Questions/Critiques • What does “outlierness” mean? • Cannot identify datapoints in histogram or scatterplot browser without switching to table view • Especially in ROI • How to intuitively interpret: • Outliers in 2D • LSE • Quadracity