Download
1 / 1
10 likes | 90 Views
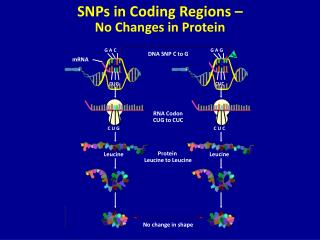
Changes in Protein Abundance Across Nutrient Conditions. Sean Hackett, Jonathan Goya, David Perlman and Josh Rabinowitz. Background. Going from peptides to proteins. Working with peptides.

E N D
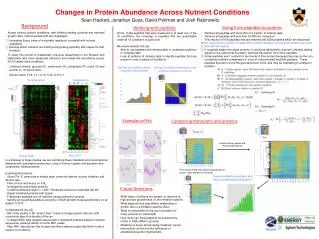
Changes in Protein Abundance Across Nutrient Conditions Sean Hackett, Jonathan Goya, David Perlman and Josh Rabinowitz Background Going from peptides to proteins Working with peptides • Across varying nutrient conditions, with differing limiting nutrients and maximal growth rates, cells must deal with two challenges: • Increasing fluxes (rates of enzymatic reactions) in parallel with nutrient availability • Sensing which nutrients are limiting and growing optimally with respect to that limitation • To study this control of metabolism, previous researchers in the Botstein and Rabinowitz labs have measured transcript and metabolite abundance across 25-36 steady state conditions. • Limiting nutrients: glucose (C), ammonium (N), phosphate (P), uracil (U) and leucine (L) (in auxotrophs). • Dilution rates: 0.05, 0.11, 0.16, 0.22, 0.30 h-1 • Of the 11434 peptides that were measured in at least one of the 15 conditions, the coverage of peptides that are quantifiable under all 15 conditions is quite poor • We need methods that are: • Able to use peptides with missing data to understand patterns in complete data • Look at patterns of missing data to identify peptides that are present in only a subset of conditions • Remove all peptides with more than 0.2 fraction of missing data • Remove all peptides with less than 32768 ions measured • This results in 5106 peptides that are retained and 6328 peptides which are discarded. • When using relative variation in peptides to predict variation in protein abundance we need to deal with two factors • If a peptide maps to multiple proteins, it should be attributed to a protein (thereby adding signal) to the extent that its pattern matches the pattern from other peptides. • Some peptides won't conform to the trends of their protein because they may be the non-covalently modified complement of a set of unascertained modified peptides. These peptides shouldn't inform the general protein trend, and may be interesting to analyze in isolation. Number of conditions where a peptide is quantifiable Overlap of peptides measured in both conditions relative to just one Transcriptomics Metabolomics Examples of fits Comparing transcripts and proteins Raw Ω Impute missing values with PCA-based method Boer 2010 Brauer 2008 In a followup to these studies, we are combining these metabolic and transcriptional datasets with quantitative proteomics, rates of nutrient uptake and secretion and composition measurements. Experimental protocol: - Grow FY4 S. cerevisiaeto steady state under the desired nutrient limitation and dilution rate - Filter culture and freeze on li-N2 - Homogenize and extract proteins - Combine sample proteins 1-1 with 15N labeled reference chemostat (p0.05) - Digest combined proteins with trypsin - Fractionate peptides into 24 fractions using isoelectric focusing - Identify and quantify peptides using time of flight tandem mass spectrometry on an Agilent Q-TOF Computational (by JG): - MS1 data (peaks in 2D: elution time * mass-to-charge) gives total ions, with uncertainty about the identity of the ion - Compare MS2 data (peptide sequences) to predicted peptides based on protein sequences, passing identity to some MS1 peaks - Align MS1 data across files to pass identities between peaks identified in only a subset of conditions From brauer 2008 infer relative abundances at dilution rates attained in this study How correlated are proteins and their corresponding transcripts ? Future Directions • What types of proteins are present or absence at high and low growth rates, or are limitation-specific • What types show a quantitative relationship to growth rate or a limitation-specific effect • What is responsible for the poor correlation of many proteins vs. transcripts • How much can these patterns be explained by motifs in DNA, RNA or proteins • Modeling of fluxes and studying metabolic versus hierarchical control and the sufficiency of established reaction mechanisms