Download
1 / 21
210 likes | 301 Views
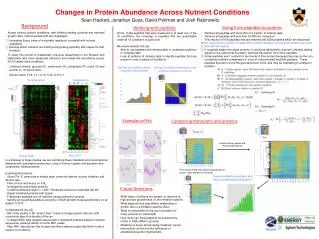
Analysis of temperature, nutrient levels, chlorophyll concentrations, and zooplankton abundance in the Labrador Sea and shelves between 1957-2006. Observations highlight shifts in environmental variables and plankton populations over the decades.

E N D
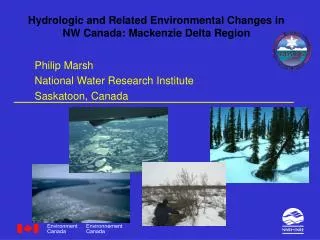
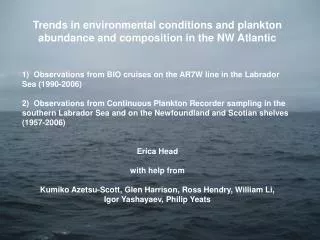
Trends in environmental conditions and plankton abundance and composition in the NW Atlantic 1) Observations from BIO cruises on the AR7W line in the Labrador Sea (1990-2006) 2) Observations from Continuous Plankton Recorder sampling in the southern Labrador Sea and on the Newfoundland and Scotian shelves (1957-2006) Erica Head with help from Kumiko Azetsu-Scott, Glen Harrison, Ross Hendry, William Li, Igor Yashayaev, Philip Yeats
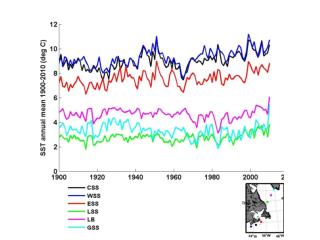
Trends in temperature along the AR7W line 1990-2006 Temperatures increased in all regions of the AR7W line between 1990 and 2006 “De-seasoned” 0-50 m temperatures during annual cruises and monthly SST anomalies relative to 1990-2006 averages. SST anomalies relative to 1971-2000 Temperature (oC)
Silicate (mmol m-3) Nitrate (mmol m-3) Trends in nutrient levels (60-200 m or 60-bottom on shelves) during annual cruises Silicate decreased everywhere Nitrate increased in the central basin and slope waters and decreased on the Greenland Shelf, with no change on the Labrador Shelf
Labrador Shelf Central Labrador Basin Greenland Shelf In situ integrated chlorophyll (May, June or July, log mg m-2) Central Labrador Sea Labrador Shelf Eastern Labrador Sea R2 = 0.02, p = 0.74 R2 = 0.41, p = 0.05 Satellite SS chlorophyll (Average Apr.-Aug., mg m-3) R2 = 0.18, p = 0.26 Year Year Year Trends in integrated (0-100 m) or sea surface chlorophyll concentration in the Labrador Sea Chlorophyll concentrations increased on the Labrador Shelf and in the central basin between 1998 and 2006 and in all regions the spring bloom started earlier. R2 = 0.15, p = 0.17 R2 = 0.03, p = 0.55 R2 = 0.03, p = 0.55
Pico- Pico- No. of cells Small nano- Small nano- Labrador Basin Large nano- Large nano- Labrador Shelf Micro- Micro- Fraction of chl. in group Nano- Nano- Pico- Pico- Trends in phytoplankton groups differentiated by size (upper row, flow cytometry) or pigment composition (lower row, HPLC pigment analysis) Between 1996 and 2005 the abundance/proportion of large cells decreased and the abundance/proportion of small cells increased on the Labrador Shelf and in the central basin.
All data were collected between late May and late July Labrador Shelf Central Labrador Sea Eastern Labrador Sea Data from late May only Zooplankton dry weight (0-100 m, g m-2) C. finmarchicus C. glacialis C. hyperboreus Other zooplankton Trends in zooplankton dry weight averaged over stations for different regions of the AR7W line (1995-2006) Zooplankton biomass showed no obvious trend with time, even when data from only one 2-week period of the year was used to eliminate the effect of seasonal dynamics. Labrador Shelf Central Labrador Sea Eastern Labrador Sea
Positions where Continuous Plankton Recorder (CPR) samples used in this analysis were collected (1957-2006) Sampling is supposed to be monthly via ships-of-opportunity but there are gaps. Before 1991 for the entire line or parts of the line - some months were missed in some years some years were missed completely From 1991-2006, monthly coverage was good Samples are from ~7 m (near-surface) <25 30-25 Latitude (oN) 35-30 53-45 40-35 45-40 SNL ESS WSS Longitude (oW) Data on plankton abundance were averaged over the areas for a given month and year and then over a given month within a “decade” and finally over all months to give an annual average for each decade. The “decades” used were 1957-1969, 1970-1979, 1980-1986, 1991-1999, 2000-2006.
Spatial patterns of phytoplankton abundance Spatial patterns were calculated by averaging the decadal “annual” averages. All three indices of phytoplankton abundance were higher west of 45oW than to the east. Diatoms and the “Phytoplankton Colour Index” (PCI) co-varied and were most abundant in the 53-45oW region, over the Newfoundland Shelf/Slope, in the Labrador Current. Dinoflagellates were most abundant on the south Newfoundland Shelf. Diatom/Dinoflagellate abundance (Cells per sample) PCI (Relative abundance)
Decadal changes in phytoplankton abundance West of 45oW East of 45oW Diatom abundance Diatom abundance (Cells per sample) West of 45oW (i.e. Newfoundland Shelf/Slope, Scotian Shelf) diatom abundance was higher in the 1990s and 2000s than in the 1960s and 1970s. East of 45oW diatom abundance did not change significantly. Diatom abundance is shown here, but all three indices of phytoplankton abundance behaved in more-or-less the same way.
Spatial patterns of zooplankton abundance Young stage Calanus (Calanus I-IV, which are mostly C. finmarchicus) were most abundant over the Newfoundland Shelf/Slope, in the Labrador Current. Arctic Calanus were most abundant over the Newfoundland Shelf/Slope, in the Labrador Current, but were much less abundant than Calanus I-IV or Calanus finmarchicus. Arctic Calanus species Calanus abundance (Number per sample)
Decadal changes in zooplankton abundance West of 45oW East of 45oW Calanus I-IV Calanus hyperboreus III-VI • In the Newfoundland Shelf/Slope waters (53-45oW): • Calanus I-IV (+ C. finmarchicus) abundance was lower in the 1990s and 2000s, than in the 1960s and 1970s. • C. hyperboreus (+ C. glacialis) abundance was higher in the 1990s and 2000s than in the 1960s and 1970s.
Summary • Along the AR7W line between 1995 and 2006: • Temperatures increased • Nitrate levels increased, silicate levels decreased • The abundance/proportion of large phytoplankton decreased • The phytoplankton bloom started earlier • Calanus finmarchicus reproduction/development occurred earlier • Along the CPR route between 1957 and 2006: • Phytoplankton abundance was highest in the 53-45oW region (Newfoundland Shelf/Slope waters, in the Labrador Current) • West of 45oW phytoplankton abundance increased between the 1970s and 1990s. • The abundance of three Calanus categories was highest in the 53-45oW region. • Two Calanus categories are Arctic species and in the 53-45oW region their abundance increased between the 1970s and the 1990s. • The third category (Calanus I-IV) is a boreal species and its abundance decreased in the 53-45oW region between the 1970s and the 1990s. • The fourth Calanus category is also a boreal species and it also decreased in abundance in the 53-45oW region between the 1970s and the 1990s.
The goal of the ESSAS programme: to compare, quantify and predict the impact of climate variability and global change on the productivity and sustainability of Sub-Arctic marine ecosystems. Primary Sub-Arctic regions: Sea of Okhotsk, Oyashio, Bering Sea, Hudson Bay, Labrador/ Newfoundland shelves, Gulf of St. Lawrence, West Greenland, Iceland, Nordic Seas, and Barents Sea There are national programmes in Japan, Iceland and the US and ESSAS is co-ordinating a series of national and international projects in IPY. Canada is involved with Norway in an international programme (NORCAN) comparing the Barents Sea/Norwegian Sea and Newfoundland/Labrador Shelf/Labrador Sea ecosystems.
The goal of the BASIN programme: to understand and predict the impact of climate change on key species of plankton and fish, and associated ecosystems and biogeochemical dynamics in the North Atlantic Subpolar Gyre System and surrounding shelves, in order to improve ocean management and conservation. The aim is to have a co-ordinated North Atlantic wide programme with the EU and US researchers focussing on the sub-polar gyre and adjacent continental shelves.
Emerging issues: Trans-Arctic invasions? A species of N Pacific phytoplankton (the diatom Neodenticula seminae) that is common in the Pacific Ocean, but that has been absent from the N Atlantic for 800,000 years has been seen in CPR samples in the NW Atlantic since 1999. The absence of ice throughout much of the Canadian Arctic archipelago in 1998 may have allowed the species to move east from the Bering Sea, through the archipelago into Baffin Bay and from there south to the Labrador Sea. Will other species follow? Scanning electromicrograph of Neodenticula seminae Locations where CPR samples containing the Pacific diatom Neodenticula seminae have been collected, and collection years. From Reid et al. (2007)
TIC Total inorganic carbon concentration (µmol/kg) pH pH Year Emerging issues: Ocean acidification Trends in TIC and pH (100-500 m) in the Labrador Sea (AR7W line) Total inorganic carbon is increasing – pH is decreasing
Spatial patterns of the abundance of calcifying organisms Foramnifera (Forams) and Coccolithophores have only been counted since the 1980s, before then there are only presence/absence data. So, the abundance index is the frequency of occurrence in samples. Forams (microzooplankton) are more often seen to the east of 45oW than to the west. Coccolithophores (phytoplankton) are most often seen south of Newfoundland or over the Reykjanes ridge. Limacina spp. (a pteropod, zooplankton species) has always been counted. Here, both frequency of occurrence and abundance show maximum values at 40-35oW. Limacina abundance (No. per sample) Frequency of occurrence
Decadal changes in the abundance of Limacina spp. West of 45oW the frequency of occurrence and abundance data generally change in the same sense in the 1960s-1970s and 1990s-2000s, but not over the entire dataset. East of 45oW the frequency of occurrence data shows a decrease west of 30oW: the abundance data does not. It may be that counting procedures have become more “rigorous” since the 1980s; changes from the 1990s to the 2000s were consistent for both datasets and abundance decreased in most areas. W of 45oW W of 45oW Frequency of occurrence Limacina abundance (No. per sample) E of 45oW E of 45oW
The Labrador Sea Filled circles are regular sampling stations on the AR7W line – sampled by physicists, chemists and biologists since 1990 or 1995. The sampling periods covered during cruises have varied between late May and late July. The boxes are areas over which STT and SSChl measurements were averaged to represent conditions on/in A – the Labrador Shelf B – the Central Labrador Sea C – the Eastern Labrador Sea C B A Latitude (oN) Longitude (oW) Bathymetry: Grey line – 200 m Black lines – 1000, 2000 and 3000 m
Trends in the C. finmarchicus Population Development Index in late May, late winter SST (1995-2006) and the timing of the start of the bloom (1998-2006) Population Development Index (PDI) = (Sum stages CI-CIII/Sum all stages) x 100 Labrador Shelf Central Labrador Sea Eastern Labrador Sea r2 = 0.03, p = 0.75 r2 = 0.37, p = 0.20 C. finmarchicus PDI (Ab. CI-IIIs/Total ab., %) r2 = 0.15, p = 0.44 Average SST Mar.-May (oC) r2 = 0.52, p = 0.008 r2 = 0.76, p < 0.001 r2 = 0.26, p = 0.09 Day of year when SSChl. reaches 1 mg m-3 r2 = 0.14, p = 0. 31 r2 = 0.35, p = 0.10 r2 = 0.47, p = 0.04
PDI in late May in individual sampling years 100 80 60 40 20 0 Labrador Shelf PDI increased Lab. Shelf Eastern Lab. Sea PDI (%) PDI in late May (%) Central Lab. Sea Central Labrador Sea PDI increased Late Early Late Early Late May June June July July PDI decreased Eastern Labrador Sea Population development in C. finmarchicus (1995-2006) Increasing temperatures and earlier spring blooms lead to earlier reproduction and faster development in C. finmarchicus populations. Population Development Index (PDI) averaged over all 2 week sampling periods for all sampling years PDI (%) = (Sum CI+CII+CIII abundance) x 100 (Total abundance)