Download

1 / 32
330 likes | 518 Views
Using Satellite-Derived PBL Properties to Estimate Land Surface Fluxes. Dr. Joseph A. Santanello, Jr. ESSIC – University of Maryland & NASA/GSFC Hydrological Sciences Branch 14 July 2005.

E N D
Using Satellite-Derived PBL Propertiesto Estimate Land Surface Fluxes Dr. Joseph A. Santanello, Jr. ESSIC – University of Maryland & NASA/GSFC Hydrological Sciences Branch 14 July 2005
Ph.D. CommitteeMark Friedl, Principal AdvisorBruce AndersonGuido SalvucciElena TsvetsinskayaWilliam Kustas (USDA-ARS)
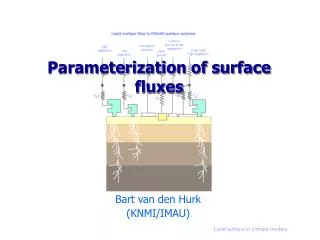
Motivation • Land surface energy balance is an important component of atmospheric and hydrologic models, the global water cycle, and the Earth’s radiation budget: Rnet – G = lE + Hs (Net Radiation – Soil Heat Flux = Latent Heat Flux + Sensible Heat Flux) • Observations of lE and Hsare limited to sparse networks of in-situ, point-scale measurements from flux towers. • The convective planetary boundary layer (PBL) grows throughout the day in response to turbulent fluxes of heat and moisture and acts as a ‘short-term memory’ of land surface processes on regional scales.
The Convective PBL Free Atmosphere PBL Height Mixed Layer Residual Layer 20 UTC 17 14 12 UTC
The Convective PBL Entrainment h Advection Advection RFD 20 17 14 12 UTC Surface sensible heat flux
The Convective PBL • Conservation methods to solving heat budgets in the PBL cannot be applied on diurnal timescales due to variability in entrainment and advection. • RFD can be significant but depends on specific humidity. • STREAMER model (J. Key et al. 2002) • Observable properties of the PBL are strongly related to surface conditions and fluxes. • Observations of the PBL can be used to estimate soil water content using a statistical approach.
The Convective PBL • Examine properties that are not directly included in the conservation equation: • Maximum PBL Height (h) • responds directly to the flux of heat into the PBL • Atmospheric Stability (g) • dq/dz: change in pot. temperature with height • Soil Water Content (w) • controls partitioning of surface fluxes • Change in 2-meter potential temperature (Dq2m) • sensitive to heat input and PBL height h g qi qf
Relationship of stability, soil moisture, 2m pot. temperature and specific humidity to PBL height Stability Soil water content h(m) h(m) g (K m-1) w (% vol) 2m Sp. humidity 2m Pot. temp h(m) h(m) Dq2m (K) Dq2m(g kg-1)
w (% vol) g (K m-1) (K/m)
Predictions of PBL height using trend surfaces and observations of soil moisture, stability and 2m potential temperature change. R2 = 0.85
Motivation • Remote Sensing now offers the ability to monitor conditions in the lower troposphere on diurnal timescales with unprecedented spectral resolution. • Vertical temperature profiles are retrieved from observed radiances in a number of spectral bands/channels. • MODISand AIRS have a high spatial and diurnal resolution compared to synoptic radiosonde networks. • Potential for remotely-sensed estimates of PBL structure to serve as a surrogate for land surface conditions.
Background ‘Original expectation’ of MODIS and AIRS temperature retrievals based on support product levels applied to observed radiosonde measurements.
Background • ARM-SGP Central Facility (Lamont, OK) • PBL data • Radiosondes launched 4 times daily: 6:30am, 9:30am, 12:30pm, 3:30pm • Profiles of temperature, humidity, pressure, and wind (10m) ** Storage, advection, mixed-layer temperature • Land surface data • Bowen ratio flux towers • Surface meteorological data • 5 soil moisture probes (0-5 cm) • Averaged across three sites surrounding the central facility ** Surface fluxes, soil moisture
Background • MODIS and AIRS Data • 44clear days in JJA 2003. • Temperature profile retrievals (L2) and cloud-cleared (L1B) radiances. • 2 complete soil dry-downs • Daily PBL heights from 300 - 3650 m. • Methodology: • a) First-order evaluation of MODIS/AIRS temperature profiles in the lower troposphere using ARM-SGP radiosonde data. • Derive key PBL properties (height, mixed-layer temperature, stability) from MODIS/AIRS. • Estimate land surface conditions and fluxes from satellite-derived properties.
MOD-T Evaluation Profiles of potential temperature retrieved from radiances measured by MOD-T compared with those measured by radiosondes at the ARM-SGP site. MOD-T 1130 UTC 2330 UTC MOD-T 1130 UTC 2330 UTC h (m) h (m) Theta (K) Theta (K) 5 July 2003 1755 UTC (12:55pm) 10 July 2003 1635 UTC (11:35am) • MOD-T simulates the free atmosphere and ‘mean’ lapse rate of temperature well. • Near-surface profiles are very similar to 1130 UTC soundings and no variation in PBL.
MOD-A Evaluation Profiles of potential temperature retrieved from radiances measured by MOD-A compared with those measured by radiosondes at the ARM-SGP site. MOD-A 1130 UTC 2330 UTC MOD-A 1130 UTC 2330 UTC h (m) h (m) Theta (K) Theta (K) 10 July 2003 1945 UTC (1:45pm) 5 July 2003 1930 UTC (1:30pm) • MOD-A responds to the heating of the mixed-layer (bend point ~4 km). • Spectral resolution is not sharp enough to capture mixed-layer structure of PBL height.
AIRS-d Evaluation Profiles of potential temperature retrieved from radiances measured by AIRS-d compared with those measured by radiosonde at the ARM-SGP site. AIRS-d 1130 UTC 2330 UTC AIRS-d 1130 UTC 2330 UTC x x x x x 15 June 2003 1930 UTC (1:30pm) 28 July 2003 1930 UTC (1:30pm) • AIRS-d has a negative temperature bias between 700 and 850 mb. • As a result, AIRS-d cannot accurately represent the mixed-layer or PBL height.
AIRS-n Evaluation Profiles of potential temperature retrieved from radiances measured by AIRS-n compared with those measured by radiosondes at the ARM-SGP site. AIRS-n 1130 UTC 2330 UTC AIRS-n 1130 UTC 2330 UTC 27 July 2003 0745 UTC (3:45am) 4 June 2003 0840 UTC (4:40am) • Overall initial lapse rate is captured well by AIRS-n. • Responds to stability in the mixed-layer (and presence of a residual layer).
Modeling Approaches Use retrieved profiles to initialize and constrain a PBL model • Use AIRS-n to initialize the OSU 1-D PBL model • Mixed layer height and structure simulated well • h +/- 200 m at w extremes OSU simulations of potential temperature initialized using AIRS-n data compared with radiosonde measurements.
MODIS and AIRS Evaluation AIRS 1130 UTC 2330 UTC MODIS/AIRS 1130 UTC 2330 UTC P (mb) P (mb) MOD-T AIRS-d MOD-A AIRS-n AIRS-d Pot. Temp (K) Pot. Temp (K) - Bias correction for AIRS is not uniform and depends on PBL and free atmosphere structure. - There still is a signal of PBL structure and evolution in the retrievals. - The ‘bulk’ storage of heat could be estimated with more accurate AIRS-d profiles.
Empirical Approaches Estimating PBL properties from AIRS profiles • PBL Height • Vertical change in q from the lowest (2m) level to the inflection point (700-850 mb) of the AIRS-d profiles. • Correlates to observed h (R2 = 0.90) • Change in 2m-Potential Temperature • Initial q can be estimated by extrapolating the slope of free-atmosphere temperature retrieval to the surface. • Final q estimated from lowest level AIRS-d estimate • Correlates with observed Dq2m(R2 = 0.72). • Stability • AIRS-n profiles correlate with observed g(R2 = 0.61).
AIRS Radiances Investigate the correlation of Level-1B radiances with surface properties a) Principal Component Analysis (Diak et al. 1990’s) b) Correlation and regression of individual channels 12 hour changes in AIRS radiances on three days in 2003 along with observed PBL and surface variables h w HsgStorage 7 July 2695 5 182 .004 210 14 June 290 18 80 .02 -52 3 June 1291 23 15 .006 -104
AIRS Radiances • Principal Component Analysis (PCA) • Need to reduce the data (2085 channels): • Use PCA and eigenvector approach (Diak et al. 1994) • Correlate and regress PC’s against PBL variables of interest • Results: • PC’s are loosely correlated with surface temperature. • Regressions explain less than 60 percent of the variance in surface fluxes.
AIRS Radiances 12-h changes in AIRS Radiances AIRS-d Radiances Correlations of the PC’s computed from AIRS radiances and the and R2 values of the linear multiple regressions of the PC’s with PBL and land surface variables (Diak et al. 1994).
AIRS Radiances b)AIRS-d Radiances • 5 channels selected • Linear regression model predicts PBL and land surface variables R2 values and wavenumbers of the 5 AIRS-d channel radiances used in linear multiple regressions with PBL and land surface variables
AIRS Radiances Observed soil moisture versus that predicted by the AIRS-d 5 channel multiple regression. w (% volumetric) R2 = 0.92 w (% volumetric) Three channels in the ‘window’ region + 15 mm CO2 channels that peak near 2 and 14 mb
Physical Rationale • Soil drying and surface heating increase radiances from window regions of the spectrum, but this signal obtained by AIRS is weaker than that predicted by Diak et al. (1994). • A secondary and stronger signal exists near the 15 micron CO2 band, which is negatively correlated with surface heating and positively correlated with soil moisture. • Why…………….? • X Direct surface signal is impossible in these channels • X Weighting functions peak too high to capture clouds or water vapor effects, confirmed by radiosonde observations. • ? Seasonal warming and raising of the troposphere from May-Sept results in an actual decrease in ~2-14 mb temperature during the summer. • - How sensitive is this effect to variability at the surface? • - Applicable at shorter than-seasonal time scales, and other regions?
Summary • MODIS and AIRSretrievals are poorly resolved in the lower troposphere, but do contain significant information on the general structure and evolution of the PBL that can be used to infer surface conditions. (Much room for improvement in profile retrieval, bias removal, and vertical resolution) • Radiancesfrom five individual AIRS-d channels can be used to predict surface moisture, fluxes, and PBL properties.
Future Research • MODIS and AIRSrecommendations: • Assess the improvement possible in retrieving PBL information using current technology (AIRS) with different weighting functions, bend points, etc. • AIRS-d retrieval bias correction • Same result seen in other regions? • Mixed-layer assumption • PBL model constraints • Investigate AIRS-d channel correlations • Other locations and conditions • Incorporate MODIS land cover products
Thank You ! NOAA/CIMSS Jeff Key ESSIC - University of Maryland NASA Earth System Science Fellowship
Empirical Approaches MODIS Brightness Temperatures • Weighting functions for bands 27, 28, and 30-36 peak at different vertical levels. • Differences between brightness temperatures at the surface (31,32) and these levels are related to PBL structure. • PBL height is correlated to changes in band differentials