Download

1 / 41
410 likes | 602 Views
EU REGIONAL POLICY. REF: EUREGIONALPOL 2010 /FEB 23feb10. (1) Introduction. Aim - to overcome regional disparities in the EU and support the integration process Structural funds (SFs) provide financial assistance to do this invest in backward regions encourage future growth in these regions

E N D
EU REGIONAL POLICY REF: EUREGIONALPOL 2010 /FEB 23feb10
(1) Introduction • Aim - to overcome regional disparities in the EU and support the integration process • Structural funds (SFs) provide financial assistance to do this • invest in backward regions • encourage future growth in these regions • Effective? Sufficient funds?
(2) Europe’s regions • Concern for Europe’s disadvantaged regions has always been part of EU priorities. • In Treaty of Rome preamble. • Pre-1986, most spending on regions was national • Rural electrification, phones, roads, etc. • 1973, Ireland (poor at the time joined); 1981, Greece joined but no major reorientation of EU spending priorities.
Entry of Spain & Portugal created voting-bloc in Council (with Ireland and Greece) that induced a major shift in EU spending priorities, away from CAP towards poor-regions. • QMV was 71% of vote, 31% to block • See graph • “Structural spending” increasing % of EU budget since 1980s.
Important figure for ‘blocking’ • QMV was 71% of vote
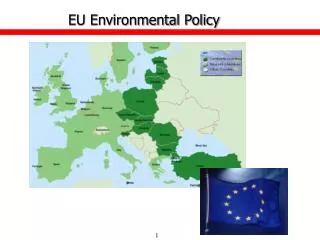
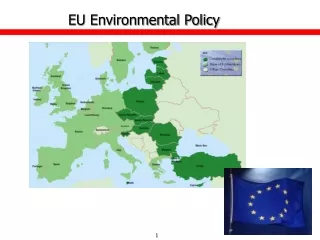
Europe’s Economic Geography: Facts • Europe highly centralised in terms of economic activity. • ‘CORE’ • 1/7th land, but 1/3rd of pop. & ½ GDP. • Periphery has lower standard of living etc.
(3) Why is an EU regional policy required? • To overcome regional disparities in the EU and support the integration process • Do your own research / see presentations for recent data on • Income inequality • Unemployment inequality • Core v periphery issue • See European Commission Economic and Cohesion Reports, Eurostat, UK House of Lords European Committee (module web)
Geographic income inequality • Within nation economic activity is very unevenly distributed
Why an EU policy in addition to national policy? • Controversial • interventionist • Arguments for an EU policy • Overcome market failure in EU,eg labour immobility • Counterbalance; EU policies may worsen regional imbalances, eg CAP, EMU, SEM • EU co-ordinate national policy
(4) Main types of funds • Structural funds (SFs) • ERDF • ESF • EAGGF (guidance) • FIFG • Cohesion fund • Others incl. • Pre accession aid
(5) Regional Policy Objectives & Reforms • ‘Minor’ reforms pre- single market • 1989 Reforms • Linked to SEM • Principles incl: • Made collaborative /EU co-ordinator • Multi-annual programme • additionality
Agenda 2000 • 2000-2006 • Aim to increase efficiency • New streamlined objective regions • 6 to 3 objectives • See below
1989-99 Objective1 regions structural adjustment Obj.2 regions industrial decline Obj 3 regions Obj 4 regions Obj 5 regions Obj 6 regions 2000-06 concentration increased Objective 1 structural adjustment < 75% EU GDP 70% SF here! ERDF Objective 2 Regions in decline & rural areas Objective 3 human resource development ESF RP Objectives
Simplification and decentralisation • Clearer division of responsibilities • Subsidiarity emphasised • But, budget fixed at 0.46% of EU GDP
2007-13 • New allocations following enlargement • Some EU15 regions now less funding (now >75%) – phase out funding • 3 objectives streamlined to 2 objectives
‘Convergence objective’ 82% of expenditure • structural adjustment • If < 75% EU GDP • Cohesion funds • ‘Regional competitiveness & employment’ 16% of expenditure • Regions in decline & rural areas • human resource development • funds from…..
Issues incl. • Dependency • Additionality • Subsidiarity • Enlargement • Absorption by CEECs • Each stage of integration - different effects on regional disparities
(6) RP: Effective? Sufficient? • Some EU convergence across EU • Convergence v divergence (see El Agraa) • Some evidence indicates divergence • At best, narrow convergence • Convergence may be explained by Theory of Comparative Advantage • Still ‘core-periphery’ disparities
Geographic Specialisation • Krugman index of specialisation shows most EU nations becoming more specialised. • EU economies seem to be specialising more in their comparative advantages. Source: Midelfart-Knarvik and Overman (2002)
EU states: more specialised on a sector basis • explained by Theory of Comparative Advantage • Eg Portugal cloth, Germany pharmaceuticals…..;
Comparative Advantage and Specialisation Source: Midelfart-Knarvik and Overman (2002)
Federal systems (Canada & US) have lower regional disparity than EU • US - 1/2 that of EU • Convergence slow (2% pa) • Underfunding despite increased finance in 1990s • SF 0.46% of EU GDP • need ability to transfer funds between regions
Aims • Realistic? Attainable? • Elimination of disparities or equality of opportunity? • Inefficiency due to problems with planning, implementation and operation (EU 1999)
BUT, within EU states - greater disparities • clustering of economic activity (agglomeration, see later for economic geography theory)
(7) Theory • 2 major approaches linking economic integration to change in the geographic location of economic activity. • Comparative advantage suggests nations specialise in sectors in which they have a comparative advantage. • Some convergence between states • New Economic Geography & endogenous growth suggest integration tends to concentrate economic activity spatially. • Greater disparities within states
Agglomeration Theory • Economic geography can • help explain empirical indications • assess the effectiveness of structural policies • Agglomeration forces exist when spatial concentration of industry creates forces that encourage further concentration • positive externalities • dynamic • attract complementary factors
In the figure below • Curve A; agglomeration index (the ratio of the number of firms in the rich region to the total no. of firms) • Agglomeration rises, income disparities widen • As firms locate in core/rich areas • Generally more profitable to produce in rich area (larger market) to benefit from economies of scale • If transaction costs between regions fall, firms will increasingly locate in the region & serve all regions
Curve R; regional income inequality index (ratio of income in the rich region to the total no. of firms) • As agglomeration rises income disparities narrow • Aggm. Reduces innovation costs • Raises innovation & NEW ENTRY • Greater competition for firms in rich region, lower profits & reduces disparity between regions
Curve S; agglomeration rises, so does innovation & growth • Agglomeration (spatial clustering) reduces cost of innovation & raises growth rates • Also, high innovation rate encourages market entry/competition, reducing profits of incumbent (concentrated in rich region), & hence reduces regional income disparities See Martin (1999) for analysis
Agglomeration Income inequalities R A Industrial agglomeration S Innovation rate & LR growth rate
Income inequalities Equilibrium degree of agglomeration, Innovation/LR growth rate R A Industrial agglomeration S Innovation rate & LR growth rate
Different impact of regional policy • RP may fail • EU RP often targets infrastructure to support SEM • Often unwanted & desired effects (trade-off) • Thus, need to chose policy carefully
Eg 1. SFs reduce transactions costs within poor regions (eg…………………) • Curve A shifts left A to A1 • For a given level of inequality , aggn falls • Firms attracted to poor region • Result: trade-off • aggn • inequlity!!! • Growth/innovation!!!
Income inequalities R A x x Industrial agglomeration x S Innovation rate & LR growth rate
Income inequalities A1 R A x x Industrial agglomeration x S Innovation rate & LR growth rate
Income inequalities A1 R A y x y x Industrial agglomeration y x S Innovation rate & LR growth rate
Eg 2. No trade-off is possible • Raise innovation/growth • Reduce aggm • Reduce inequality • If SFs reduce costs of innovation • Incl. R&D, education, telecommunications (faster broadband) • ‘less regional’!! • See Martin (1999) for analysis
(8) Conclusion • Despite some narrowing of disparities, they still exist • Disparities within countries widening • RP linked to integration policies • Regional policy • effective? • sufficient?
Further reading • Baldwin & Wyplosz, J Pelkmans, S Senior-Nello (all on general reading list) • Martin (1999), ‘Are European regional policies delivering?, EIB Papers, vol 4,2 • Amiti M, “New trade theories and industrial location in the EU, Oxford Review of Econ Poliy • Krugman & Venibles (1990), Integration and the competitiveness of peripheral industry, in Bliss & Braga de Macedo (eds), Unity with diverisity in the European Economy, Cambridge Uini Press • Midelfart-Knarvik & Overman (2002), Delocation &European integration. Is structural spending justified?, Economic Policy