Regional Policy
260 likes | 507 Views
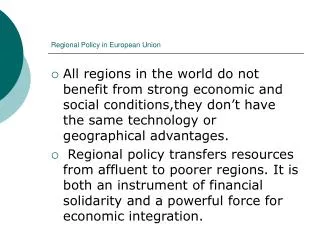
Regional Policy. Convergence or Divergence. The early days. No mention of regional policy or regional imbalance in the Treaty of Rome. Why? The six founding member-states were relatively homogenous in economic terms (except for Southern Italy).

Regional Policy
E N D
Presentation Transcript
Regional Policy Convergence or Divergence
The early days No mention of regional policy or regional imbalance in the Treaty of Rome. • Why? • The six founding member-states were relatively homogenous in economic terms (except for Southern Italy). • It was thought that the prosperity created by the creation of a free trade area and a customs union would generate economic growth throughout the EEC as a whole and raise the standard of living throughout.
1973: Ireland, Denmark and UK (Irl: 60%of EU average 1981 Greece 1986: Spain and Portugal These enlargements introduced a ‘regional dimension to EEC, ie. the economic and social disparities between states increased Mid 60s the gap in per capita GDP between the ten richest and the ten richest regions was 4:1 By 1980s this was 5:1 The first and second Enlargement
Regional Policy: modest beginnings • 1975: European Regional Development set up • aim was to provide financial assistance for industrial and infrastructural projects in the disadvantaged areas. • Funding: originally 5% of EU budget and up to late 80s, only 7% – 8% of EU budget was spent on regional policy (ERDF)
Regional Policy: A Treaty base • Single European Act • A new Title V: Economic and Social Cohesion; now TitleXVII • This committed the EC to “reducing disparities between the various regions and the backwardness of the least favored nations” • Reform of the Structural Funds, 1988: doubled in size (total : ECU 60bn) • Regional policy to be based on 4 principles
Principles of Regional Policy(1) • Additionality: • Structural funds must add to and NOT substitute for member-state public expenditure
Principles of Regional Policy(2) • Partnership and Programming: • EU to work in ‘partnership’ with member states and regional authorities • Ireland: National Development Plan Community Support Framework
Principles of Regional Policy(3) • Concentration: • Most funding should be concentrated on where the money is needed!
Structural Funds: www.europa.eu.int • four Structural Funds allow the European Union to grant financial assistance to resolve structural economic and social problems : • the European Regional Development Funds (ERDF): principal objective is to promote economic and social cohesion within the European Union through the reduction of imbalances between regions or social groups; • the European Social Fund (ESF), the main financial instrument allowing the Union to realise the strategic objectives of its employment policy; • the European Agricultural Guidance and Guarantee Fund (EAGGF - Guidance Section), contributes to the structural reform of the agriculture sector and to the development of rural areas; • the Financial Instrument for Fisheries Guidance (FIFG), the specific Fund for the structural reform of the fisheries sector. • Cohesion Fund : finances projects linked to the environment and trans-european transport systems of Member States whose GDP is less than 90% of the European average, • pre-accession structural instrument (ISPA), one of three instruments to aid candidate countries in preparation for accession to the European Union, also support expenditure on development of infrastructure in certain Member States and candidate countries.
Relative wealth in the EU • 1994: output per head, in NUTS 2 regions in the 15 member states varied from 196% to 37.7 % of EU average • 10% lived in least prosperous areas, average GDP per head index of 58 • 20% lived in areas with a per capita GDP of less than 75% • 10% lived in areas with average index of 153 (Hamburg 196, Oberbayern 161, Brussels 183, Ile de France 161, regions in the ‘blue banana’ region, extending from Greater London, through Belgium and Netherlands along the Rhine into nothern Italy
Which regions received EU financial assistance during the 1994-1999 programming period The EU's Structural Funds targeted financial assistance at disadvantaged regions according to priority objectves 1, 2, 5b and 6.
Map of objective 1 areas 2000-2006 • Regions eligible under Objective 1 • Phasing-out Objective 1 • Special Programmes
Structural Funding Allocation for 2000-06
Structural funds: allocation • Resources under the Structural Funds are allocated on the basis of programming periods: the previous programming period ran from 1994 to 1999; the present period is 2000-06. Financial assistance is in the form of non-refundable grants channelled in three ways: • Objective programmes (94%) ERDF, ESF, Guidance part of CAP, Cohesion Fund • Community Initiative Programmes (5.35%)- managed in Ireland by ADM • Innovative measures.(0.65%) • Programmes are managed by designated authorities in the Member States, whereas innovative measures are managed by the Commission itself.
Structural funds: 2000 -2006 • The Structural Funds: budget of EUR 213 billion for 2000-06. • Financial assistance targeted under three Objectives (93% of the budget) and four Community Initiatives (5.35% of the budget). • Objective 1Development and structural adjustment of regions whose development is lagging behind (EUR 135.9 billion); Objective 2Economic and social conversion of areas facing structural difficulties (EUR 22.5 billion); Objective 3Adaptation and modernisation of national policies and systems of education, training and employment (EUR 24.05 billion); Coastal areas: FIFG, contributes to national programmes to encourage measures to adapt fisheries structures (EUR 1.106 billion).
1988 1993 1999 2000- Ag price support 60.7% 50.9% 45.7% 45.8% Structural funds 19.6% 28.6% 32.6% 35.4% Cohesion Fund 2.2% 3.1% 2.8% Total: billion ECU 45.3 69.2 84.1 97.2 Total payment as % of EC GDP 1.10 1.2 1.27 1.27 Community resources and structural policies
Investment competition: - firms played one area off another as governments tried to influence where these firms set up Government competition: irrational, wasteful Some examples: Ford-VW joint venture to make minivans in Setubal near Lisbon£360 million of the £1.8 billion paid by EC and Portuguese government; Overall public share of cost, 40% Italy: govt. paid 50% of American Texas Instruments’ Avezzano plant Regional aid
Case studies of activities undertaken with EU funding • Stepping Stones • Women in Agriculture • ESB Links Island Communities • Rural Post Office Development Programme. • VTOS • Sea Research Vessel - Celtic Voyager. • Enterprise Link - Dublin/Belfast Railway • Lough Derg Catchment Protection Scheme. • http://www.csfinfo.com/htm/case_studies/index.htm • NDP/CSF Information Office15 Hatch StreetDublin 2Telephone: 01 6396280 LoCall: 1890 230 030Fax: 01 639 6281Public Office Open: Monday - Friday 10.00 am - 12.30 pmand 2.00 pm - 4.30 pm
Useful documents • Sixth Periodic Report on the social and economic situation and development of the regions of the European Union • http://www.europa.eu.int/comm/regional_policy/dwnld/pdf/radi/en/2_s1_en.pdf • Sixth Periodic Report on the social and economic situation and development of the regions of the European Union • http://www.europa.eu.int/comm/regional_policy/dwnld/pdf/radi/en/2_s1_en.pdf • Sixth Periodic Report on the social and economic situation and development of the regions of the European Union • http://www.europa.eu.int/comm/regional_policy/dwnld/pdf/radi/en/2_s1_en.pdf
OPINIONof the Committee of the Regionsof 12 April 2000on theSixth Periodic Report on the Social and Economic Situationand Development of Regions in the European Union(SEC(1999) 66 final) • A decade on, it is still the same 25 regions that are least affected by the problem. In the regions with least access to work and jobs, the unemployment rate has risen over the same period from 20% to 24%, in contrast to the 4% rate in the more privileged areas. Long-term unemployment is on the increase, along with unemployment among young people looking for their first job. • There has been genuine convergence, and notes that over the last 10-year period, GDP in the 10 regions where it was lowest has risen from 41% of the EU average to 50%. It also mentions that the GDP of the 25 poorest regions is up from 52% to 59% of that average, while the GDP of the four "cohesion" countries has shifted from 65% to 76.5% of the average (estimated at 78% for 1999). It states in particular that trade between those four countries and the Member States of the Union doubled over the same period.
Future of Regional Policy • The future of regional policy: debate in the European Parliament • (27 September 2001) • Regional policy was a focal point of the European Parliament plenary session of 19-20 September. Mrs Annemie Neyts-Uyttebroeck, on behalf of the Belgian Presidency of the EU Council, and Commissioner Michel Barnier seized the opportunity to present the first reflections in the debate on the future of cohesion policy and to outline the coming stages, in terms of both procedure and substance. • http://www.inforegio.cec.eu.int/
6th Report • map 29 of the report gives a remarkable summary of the reality of the centre-periphery relationship as it stands in Europe. • http://www.europa.eu.int/comm/regional_policy/document/doc1_en.htm • map 29 of the report gives a remarkable summary of the reality of the centre-periphery relationship as it stands in Europe. • http://www.europa.eu.int/comm/regional_policy/document/doc1_en.htm • map 29 of the report gives a remarkable summary of the reality of the centre-periphery relationship as it stands in Europe. • http://www.europa.eu.int/comm/regional_policy/document/doc1_en.htm
List of ERDF programmes in the EU in chronological order - 1999 Date of Adoption Title Type of Intervention Programs- AthensProvision of gas-fuelled bus and a natural gas stationOP18/06/99 Belgium URBAN Bruxelles-Capitale (Anderlecht)CIP20/05/99 INTERREG II C E / F / IRL / P / UK Atlantic Area CIP27/04/99 Italy "Crisis area of Gela" (Sicile) - Global GrantGG11/03/99 Spain Territorial Employment Pacts (Obj.1)OP02/03/99 Italy "BIC Basilicata" - Global GrantGG11/02/99 Italy "Alimentaria" - Global GrantGG