Download
1 / 38
530 likes | 1.45k Views
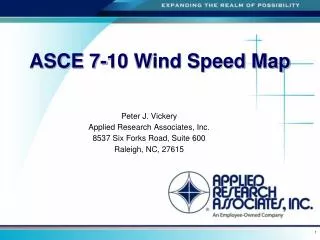
ASCE 7-10 Wind Speed Map. Peter J. Vickery Applied Research Associates, Inc. 8537 Six Forks Road, Suite 600 Raleigh, NC, 27615. Summary. New Hurricane Simulation Model Windfield Filling (weakening after landfall) Holland B (pressure-wind Relationship)

E N D
ASCE 7-10 Wind Speed Map Peter J. Vickery Applied Research Associates, Inc. 8537 Six Forks Road, Suite 600 Raleigh, NC, 27615
Summary • New Hurricane Simulation Model • Windfield • Filling (weakening after landfall) • Holland B (pressure-wind Relationship) • Tracks and pressures (Landfall location and intensity) • Results in Lower Design Wind Speeds • Moving to strength wind speed map (wind load factor = 1 for strength design, 0.63 for ASD) • Strength map corresponds to 700 year RP • ASCE 7-05 Equivalent Map = V700/√1.6 • Cat III and IV structures use 1700 year RP winds • Cat I structures use 300 year RP winds
V700/√1.6 • ASCE 7-05 • ASCE 7-10 Equivalent
QUESTION:If the new model produces more intense hurricanes (defined by pressure) than the old model, why have the design wind speeds gone down?
Summary • New model produces more landfall intense hurricanes by pressure than the model used to develop ASCE 7, yet results in lower wind speeds. • Additional flight level data and improved statistical model for B resulted in lower ~10% estimates of the Holland B parameter. • In some areas (e.g. Florida Panhandle) the new model produces fewer land falling strong hurricanes, and hence wind speeds are lower than associated with the reduction of B alone.
Windborne Debris Region • Current Standard • V > 120 or 110 within one mile of coast • Exact Mapping (new 700 year map) • 120√1.6=152~150 • 110 √1.6=139~140 • New WBDR is intended to mimic current standard, pending new research • V > 140 or 130 within one mile of coast • Results in less area within WBD Region that the existing standard