Download
1 / 11
110 likes | 227 Views
This study focuses on the statistical analysis of 5-10 minute averages of wind speed, essential for integrating high shares of wind energy into grids. Utilizing a year’s worth of offshore data from Hywind and ten years of onshore data from Lindesnes, the research examines wind speed increments, standard deviation, kurtosis, and the empirical distributions of increments. A heuristic model is proposed to effectively manage asymmetry and increased kurtosis, demonstrating high accuracy, especially for elevated initial wind speeds. This analysis provides valuable insights for optimizing wind energy systems.

E N D
Statistics of 5-10 min averages of wind speed H.M. Olsson, H.G. Beyer Institute of Engineering University of Agder Grimstad, Norway
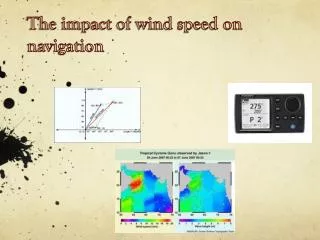
Introduction • Grid integrations of high shares of wind energy requires knowledge of the temporal pattern of the power flows on all time scales time scales: 1h, 1s information (mostly) condition: on-shore available time scales: 5-10min information rarely condition: off-shore available
Data Hywind: off-shore 500s averages of wind speed 1 year of data Lindesnes: on-shore 600s averages of wind speed 10 years of data
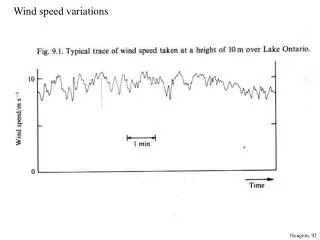
Data analysis Wind speed (500s,600s ave.) increments: increments sorted by initial wind speed v(t) [example onshore]
Data analysis • distribution of increments • Standard deviation • Kurtosis • in dependence of initial wind speed
Options for modelling of empirical distribution • Gaussian distribution • Castaing distribution Off- shore, initial wind speed 10m/s
Options for modelling of empirical distribution • Castaing distribution • used for analysing (short term) turbulence data parameters , s directy linked to standard deviation and kurtosis gives good representation for ’average’ initial wind speeds 6 m/s
Castaing/Gaussian limitations • Higher initial wind speeds Empirical: asymmetric distribution of increments both, Gaussian and Castaing fail. cumulative distribution of increments offshore, initial wind speed20 m/s
Heuristic model to cope with asymmetry and increased kurtosis • Model proposed • parameters and β control asymmetry and skewness
Heuristic model to cope with asymmetry and increased kurtosis model performance: on-shore initial wind speed: 20 m/s heuristic model well applicable for all initial wind speeds
Statistics of 5-10 min averages of wind speed Conclusions • For intermediate initial wind speeds the Castaing distribution gives a good representation of the distribution of wind speed increments from knowledge of standard dev. and skewness • An heuristic model provides the most accurate results, notably for elevated initial wind speeds • The heuristiclly added exponential term breaks the direct link of model parameters to mean and std.dev. • The heuristic model needs a time consuming fitting process • Acknowledgements: data kindly made available by Agder energi AS and Statoil, Norway