Download
1 / 30
300 likes | 381 Views
Working Smart: Using the principles of Quality Improvement in your daily work. November 2006 Aging and Disability Services Administration. Quote. Every system is perfectly designed to achieve exactly the results it achieves. D.M. Berwick. Principles of Quality Improvement.

E N D
Working Smart: Using the principles of Quality Improvement in your daily work November 2006 Aging and Disability Services Administration
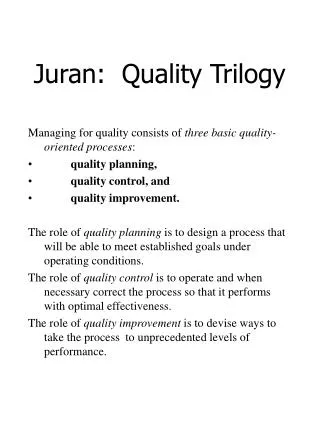
Quote Every system is perfectly designed to achieve exactly the results it achieves. • D.M. Berwick
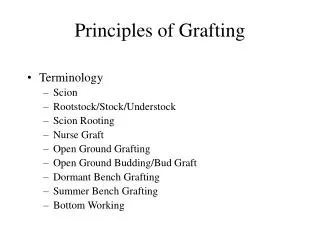
Principles of Quality Improvement Using an organized effort to equip people with knowledge and the tools for continuous improvement
Principles of Quality Management • Focus on the client • Understanding work as systems and processes • Teamwork • Focus on the use of data
Focus on the Client • Services should be designed to meet the needs • Which customer needs are met? • Which customer needs are not met?
Understanding Work • Define and understand key processes • Use tools to provide visual images of the processes to improve these processes
Teamwork • Develop ownership to process improvements • Ask the “experts” the people that actually “do” the work what needs to be improved. • Involve people/staff from different departments.
Focus on the use of Data • Analyze processes • Identify problems • Measure progress • Verify changes
The Framework for Improving How QI Integrates Content of Care and the Process of Providing Care Output Outcomes Improved quality of care and health status (e.g., standards developed and applied) • Content of Care • What is done • Norms • Standards • Protocols • Guidelines • Process of Care • How is it Done • Quality Improvement approaches • Cycle of Learning and improvement
Quality Improvement Methods Key Steps of Quality Improvement
Quality Improvement Methods Test Results, Determine Next Steps
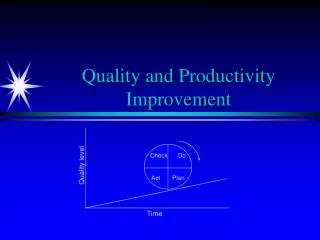
Continuous Improvement The Plan, Do, Study, Act Cycle • .Plan • Make a plan for change • Collect baseline data • Communicate the test of the change • 2. Do • Test the change • Document the results of the change • Continue to monitor data • 4. Act • Modify/abandon plan • Or implement a successful plan • Develop ongoing monitoring and consider implementing the system (as opposed to testing the change on a small scale) • 3. Study • Verify the effects of the change • Check results
From Simple to Complex Spectrum of Approaches to Quality Improvement Complexity Individual Problem Solving Rapid Team Problem Solving Systematic Team Problem Solving Process Improvement
Presentation materials from a paper written by M. Rashad F. Massoud, MD, MPH Associate Quality Assurance Project Director, Russia, NIS, Asia, and the Middle East – Advances in Quality Improvement: Principles and Framework – slides 9 -13 • Dr. Steve Marshall – Understanding Data – slide 8
Some of the Tools • Brainstorming • Process Flow • Cause and Effect Diagram • Baseline Measures • Bar Chart
Quote Insanity: doing the same thing over and over and expecting different results. • Albert Einstein
Brainstorming • Write the topic on an easel chart • Allow the team to brainstorm alone first • Post each idea as it is presented • After ideas are presented, clarify if necessary
Get out of Bed? Yes Get up Watch Morning News Make Coffee No Late for work Arrive at work on time Drive to work Pack my lunch & briefcase Get showered & Dress PROCESS FLOW CHARTS • Agree on where the process begins and ends • List all the other major steps in the process • Sequence the steps as they happen • Flow-chart the process
People Equipment Patient Falls Materials Methods • Identify the effect (outcome) you want to analyze • Decide on the major ‘categories’ Staff didn’t respond in a timely manner Beds too high Showers too small Patient too heavy to transfer Inappropriate lifting method used Not enough training in how to lift patient No hand rails available • Brainstorm all possible causes and add to diagram • Circle the most likely causes and rank them • Verify your conclusions with data
Quote Not everything that can be counted counts and not everything that counts can be counted. • Albert Einstein
Baseline Measures • Baseline Measures: Where are we now? How big is the problem? Time? Cost? • Results: How are we going to KNOW we have made an improvement • Operational Definitions: How clean is clean? What is a “fast delivery”?
Bar Chart A graphical representation of the number of occurrences of some characteristic for a set of data.
Quote Learning is not compulsory and neither is survival. • W. Edwards Deming
Who to contact for more information - • Lynne Korte @ 360.725.2545 • John Ficker @ 360.725.2370


![Work Improvement in Small Enterprises ( WISE ): good examples from Asia [CD-ROM] [Publications]](https://cdn3.slideserve.com/6302815/work-improvement-in-small-enterprises-wise-good-examples-from-asia-cd-rom-publications-dt.jpg)