Week 8 - Quality Management Learning Objectives
730 likes | 1.74k Views
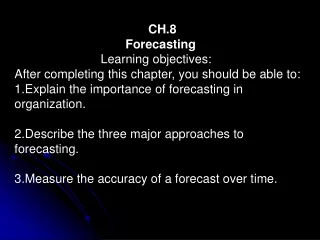
Week 8 - Quality Management Learning Objectives You should be able to: List and explain common principles of quality management (QM) List, distinguish between, and describe the processes and tools of Quality Planning, Assurance, and Control Apply QM principles to Project Management

Week 8 - Quality Management Learning Objectives
E N D
Presentation Transcript
Week 8 - Quality ManagementLearning Objectives You should be able to: • List and explain common principles of quality management (QM) • List, distinguish between, and describe the processes and tools of Quality Planning, Assurance, and Control • Apply QM principles to Project Management • Apply QM principles to software development project management • Demonstrate how the CMM incorporates QM principles
Quality: • is everyone’s job, • comes from prevention not inspection, • means meeting the needs of customers, • demands teamwork, • requires continuous improvement, • involves strategic planning, • means results, • requires clear measures of success.
History of QM/QC/QA • Deming: plan, do, check, act • Juran: improvement, planning, control • Crosby: zero defects, management commitment • Ishikawa • quality circles, root cause of problems • Taguchi: prevention vs. inspection • Feigenbaum: worker responsibility
Quality Management • Organization-wide commitment: culture • Results and measurement focus • Tools and technical support needed • Training and learning • Continuous improvement of each process • Is it necessary? • Can it be done better?
Pre-production leadership information and analysis strategic quality planning Production human resource allocation quality assurance 7 Malcolm Baldrige Award Categories Post-production • quality results • customer satisfaction
ISO 9000 Standard:5 Elements (500 points) • Quality Planning • Performance Information • Cost of Quality (economics) • Continuous Improvement • Customer Satisfaction
Quality in Project Management I • ISO 9000, TQM, CQI principles • Prevention over inspection • lower cost, higher productivity, more cust. satisfaction • Management responsibility and team participation • Plan-do-check-act (re: Deming, etc.) - PDCA • Applied successfully in environments that have well-defined processes and products • More difficult in areas like software development
Quality in Project Management II • Customer satisfaction • validation: “the right job done” • Conformance to specifications • verification: “the job done right” • Fitness for use • can be used as intended • Satisfaction of implied or stated needs • All project stakeholders considered • Project Management: making implicit needs explicit • Project Processes and Product • continuous improvement of both
Product Description QualityStandards Checklists QualityManagementPlan Project Scope Quality Planning Work Results Quality Policy Quality Assurance OperationalDefinitions Quality Control Quality Improvement Actions
Quality Planning (QP) • Identifying relevant quality standards • Determining how to meet them • QP inputs: • quality policy: adopted, disseminated • scope and product description • standards, regulations
Software Quality Planning • Functionality • features: required and optional • Outputs • Performance • volume of data, number of users • response time, growth rate • Reliability: MTBF (mean time between failures) • Maintainability
QP Outputs • Quality management plan • how team will implement quality policy • structure, responsibilities, resources, processes • (same as project plan?) • Operational definitions • metrics: what it is and how it’s measured • Checklists • industry-specific
Quality Assurance (QA) • Evaluating project performance regularly to assure progress towards meeting standards • Inputs: • quality management plan • operational definitions • results of measurements • Outputs: • quality improvement actions • Tools: QP tools, quality audits
QP/QA Tools • Cost / benefit analysis and tradeoffs • less rework = higher productivity, lower costs, stakeholder satisfaction • Design of Experiments • comparison of options, approaches • Benchmarking • comparison of project practices to best practices • Cause and effect (fishbone, etc., diagrams)
Quality Control (QC) • Monitoring project results • Measuring compliance with standards • Determining causes if not in compliance • Identifying ways to eliminate causes • Performed throughout project life cycle
Inputs: Work results Quality Management Plan Operational Definitions Checklists Outputs: Quality Improvement Acceptance decisions Rework Process adjustments corrective or preventive actions Completed checklists project records QC Inputs and Outputs
Inspection: measuring, examining, testing products Control Charts: monitor output variables detect instability in process graphical display of results Pareto analysis 80 / 20 rule histogram: frequencies Statistical sampling acceptable deviation 6-sigma 7-run rule QC Tools
Statistical Quality Control • Prevention • keeping errors out of the process • Inspection • keeping defects from the customer • Sampling: attributes and variables • Tolerances: acceptable ranges • Control limits: acceptable levels
Testing (Software) • During most phases of product development • Unit tests • Integration testing • System testing • User acceptance testing
Improving Software Quality • Leadership • top management and organization-wide commitment to quality • Costs of quality • cost of non-conformance • costs: prevention, appraisal, failures, testing • Work environment
PMI Maturity Model: 5 levels • Ad-hoc: chaotic, chronic cost & schedule delays • Abbreviated: processes in place, but not predictable • Organized: documented, standards that are used • Managed: measures are collected • Adaptive: • feedback enables continuous improvement • project success is norm
Capability Maturity Model (CMM) - 5 levels 1. Initial: chaotic, heroic efforts, unpredictable 2. Repeatable: processes & standards established 3. Defined: documented standards, training, use 4. Managed: quantitative measures, predictable 5. Optimizing: defect-prevention, organization-wide continuous improvement
CMM and Quality(see Appendix A: goals for key process areas) Level 2: • requirements management (customer focus) • project planning (quality planning) • project tracking and oversight (quality control) • software quality assurance • configuration management (prevention)
CMM Level 3 and Quality • organization process focus (commitment) • organization process definition (operational definitions) • training program • software product engineering (prevention) • intergroup organization (teamwork) • peer reviews (teamwork)
CMM Level 4 and Quality • Quantitative process improvement • Software quality management goals • planned and measured CMM Level 5 and Quality • Defect Prevention (prevention) • Technology and Process Change Management (continuous improvement)
Achieving Software Quality • Focus on critical requirements early • Use metrics early and continuously • Provide development tools supporting: • configuration control, change control • test automation, self-documentation • abstraction, reliability, reuse • Early and continuous demonstration-based evaluations • Major milestone demonstrations assessed against critical requirements
Software Quality Measurement • Software quality measured by ease of change • Examples of data collected: • Number and types of changes • number of components / effort (FPs, SLOC, classes...) • number of change orders (SCOs) • number of defective and fixed components • Baseline: total size (SLOC, FP, classes, etc.) • Scrap: broken code, may or may not be fixed • Rework: healthy early in project, should decrease
SCO: Software Change Order 1. rework a poor quality component (fix) 2. rework to improve quality (enhancement) 3. accommodate new customer requirement (scope change) Configured Baseline: • the set of products subject to change control • size of “completed” components
Software Quality Metrics • Modularity: • breakage localization: extent of change re: baseline size • Adaptability • cost of change (effort needed to resolve and retest) • Maturity • number of SCO’s over time = MTBF during testing • Each of above 3 should decrease over time • Maintainability • productivity of rework / productivity of development
Operational Definitions • Defects: measured by change orders SCOs • Open rework (breakage) • broken components measured by SCOs • Closed rework (fixes) • fixed SCOs • Rework effort: effort expended fixing SCOs • Usage time: baseline testing in normal use
Quantifying Quality Metrics • Modularity: • breakage / SCOs • Adaptability • rework effort / SCOs • Maturity • usage time / SCOs (mean time between defects) • Maintainability • (percent broken) / (percent rework vs. total effort) • End-product and “over time” indicators
Pros Team development Accountability Determine causes of defects 20%: critical components Cons Superficial Not cost effective Other QA activities are more effective Peer inspections: pros and cons
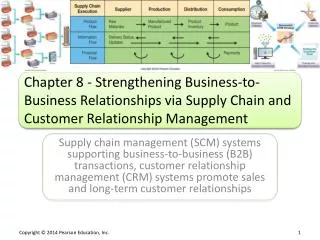
Project Quality Management (cont.)
Quality of IT Projects • Many people joke about the poor quality of IT products (cars and computers joke) • People seem to accept systems being down occasionally or needing to reboot their PCs • There are many examples in the news about quality-related problems
What Went Wrong? • In one of the biggest software errors in banking history, Chemical Bank mistakenly deducted about $15 million from more than 100,000 customer accounts one evening. The problem resulted from a single line of code in an updated computer program that caused the bank to process every withdrawal and transfer at its automated teller machines (ATMs) twice. For example, a person who withdrew $100 from an ATM had $200 deducted from his or her account, though the receipt only indicated a withdrawal of $100. The mistake affected 150,000 transactions from Tuesday night through Wednesday afternoon. • In 1996 Apple Computer's PowerBook 5300 model had problems with lithium-ion battery packs catching fire, causing Apple to halt shipments and replace all the packs with nickel-metal-hydride batteries. Other quality problems also surfaced, such as cracks in the PowerBook's plastic casing and a faulty electric power adapter. • Hundreds of newspapers and web sites ran stories about the "Melissa" virus in March of 1999. The rapidly spreading computer virus forced several large corporations to shut down their e-mail servers as it rode the Internet on a global rampage, according to several leading network security companies.
What Is Project Quality Management? • The International Organization for Standardization (ISO) defines quality as the totality of characteristics of an entity that bear on its ability to satisfy stated or implied needs • Other experts define quality based on • conformance to requirements: meeting written specifications • fitness for use: ensuring a product can be used as it was intended
Project Quality Management Processes • Quality planning: identifying which quality standards are relevant to the project and how to satisfy them • Quality assurance: evaluating overall project performance to ensure the project will satisfy the relevant quality standards • Quality control: monitoring specific project results to ensure that they comply with the relevant quality standards while identifying ways to improve overall quality
Modern Quality Management • Modern quality management • requires customer satisfaction • prefers prevention to inspection • recognizes management responsibility for quality • Noteworthy quality experts include Deming, Juran, Crosby, Ishikawa, Taguchi, and Feigenbaum
Quality Experts • Deming was famous for his work in rebuilding Japan and his 14 points • Juran wrote the Quality Control Handbook and 10 steps to quality improvement • Crosby wrote Quality is Free and suggested that organizations strive for zero defects • Ishikawa developed the concept of quality circles and using fishbone diagrams • Taguchi developed methods for optimizing the process of engineering experimentation • Feigenbaum developed the concept of total quality control
Malcolm Baldrige Award and ISO 9000 • The Malcolm Baldrige Quality Award was started in 1987 to recognize companies with world-class quality • ISO 9000 provides minimum requirements for an organization to meet their quality certification standards
Quality Planning • It is important to design in quality and communicate important factors that directly contribute to meeting the customer’s requirements • Design of experiments helps identify which variables have the most influence on the overall outcome of a process • Many scope aspects of IT projects affect quality like functionality, features, system outputs, performance, reliability, and maintainability
Quality Assurance • Quality assurance includes all the activities related to satisfying the relevant quality standards for a project • Another goal of quality assurance is continuous quality improvement • Benchmarking can be used to generate ideas for quality improvements • Quality audits help identify lessons learned that can improve performance on current or future projects
Quality Control • The main outputs of quality control are • acceptance decisions • rework • process adjustments • Some tools and techniques include • pareto analysis • statistical sampling • quality control charts • testing
Pareto Analysis • Pareto analysis involves identifying the vital few contributors that account for the most quality problems in a system • Also called the 80-20 rule, meaning that 80% of problems are often due to 20% of the causes • Pareto diagrams are histograms that help identify and prioritize problem areas
Statistical Sampling and Standard Deviation • Statistical sampling involves choosing part of a population of interest for inspection • The size of a sample depends on how representative you want the sample to be • Sample size formula: Sample size = .25 X (certainty Factor/acceptable error)
Commonly Used Certainty Factors 95% certainty: Sample size = 0.25 X (1.960/.05) = 384 90% certainty: Sample size = 0.25 X (1.645/.10) = 68 80% certainty: Sample size = 0.25 X (1.281/.20) = 10
Standard Deviation • Standard deviation measures how much variation exists in a distribution of data • A small standard deviation means that data cluster closely around the middle of a distribution and there is little variability among the data • A normal distribution is a bell-shaped curve that is symmetrical about the mean or average value of a population