Download
1 / 15
150 likes | 290 Views
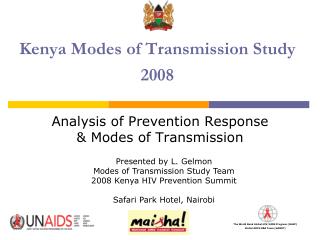
Kenya Modes of Transmission Study 2008. Analysis of Prevention Response & Modes of Transmission. Presented by L. Gelmon Modes of Transmission Study Team 2008 Kenya HIV Prevention Summit Safari Park Hotel, Nairobi. Background. Kenya has a mixed epidemic:

E N D
Kenya Modes of Transmission Study2008 Analysis of Prevention Response & Modes of Transmission Presented by L. Gelmon Modes of Transmission Study Team 2008 Kenya HIV Prevention Summit Safari Park Hotel, Nairobi
Background • Kenya has a mixed epidemic: • National prevalence ranging from 6.7% (KDHS2003) to 7.4% (KAIS 2007); Casual heterosexual sex (CHS) contributing 2/3 new infections; substantial gains made in roll out of ART. • Great regional variations, ranging from almost 1% (Northeast Province) to above 12% (Nyanza Province, and up to 30% in some fishing communities of Districts adjacent to Lake Victoria area). • Most prevention resources (almost ¾) go toward VCT, PMTCT, and ABC. • Over time, proportion of total funds allocated to prevention has been decreasing (<25% of total). • 95% of HIV/AIDS funding comes from external sources.
Introduction Key questions about the epidemic the study aimed to answer. magnitude? trends and phase, character & potential? transmission dynamics & sources of most new infections? do the national strategic priorities, investments & interventions, match the major drivers of transmission? Do interventions reflect proven approaches & global best practice? Is established wisdom and thinking being challenged? Can the conclusions be aligned with the realities of the current policy environment?
IntroductionCont. Leadership of country process Study conducted December 2007 – July 2008 Team of three: epidemiologist/team leader (L. Gelmon), prevention (P. Kenya), modelling/data (F. Oguya) Coordinated & supervised by UNAIDS-M&E-Kenya (G.Haile) and NACC Policy Research and M&E (B. Cheluget). Kenya MoT Technical Team – (KMoTTT) established to provide leadership, technical advice, review progress, provide suggestions, clear reports. Others included NACC officials, MoH, CDC, KEMRI, National M&E Committee, UNAIDS, Univs. Nairobi and Kenyatta, research insts. in Nairobi, Mombasa & Kisumu. Regular briefings to NACC Board, ICC & Advisory Comm.
Methods Incidence Modeling tool modifiedto introduce additional categories for clients of sex work “Long Distance Truck Drivers & partners”, “Migrant Farm Workers & partners” and “Other’ Clients & their partners” Two new groups - Fishing Communities and Prison populations. Because of heterogeneity of the epidemic, the team produced one national model and three sub-national models to strengthen the analysis. Not included in the model - refugees, women who have been subjected to sexual violence, etc. partly because of a lack of specific quantitative data.
STATUS OF THE EPIDEMIC – decreasing incidence – 0.5% - (NACC, 2006) • New trend is being observed: UNAIDS Incidence Modeling estimates close to 90,000 new infections in 2007 (Kenya MoT study).
STATUS OF THE EPIDEMIC – geographic heterogeneity – Nyanza has 30% of national prevalence
KYR - The Prevention Response • Kenya policy promotes IEC to the general population (abstinence, condoms, safe sex) • Increase in VCT sites, but only 24% (15+ years) know their HIV serostatus • Prevention with Positive (PwP) programmes not widely implemented. • Condom distribution very erratic and less than half the target (120m/10mpm/5-6mpm) • No national level intervention programmes being implemented for MSM, SWs and IDUs • Youth-oriented programmes claim less than 5% of prevention resources.
Key findings • HIV response is mainly national with few Sub-nationally-driven programmes. • Programmes focussed on specific most-at-risk populations are few and far in between. • 2/3 of new infections are through heterosexual contact, partners and fishing communities. • IDUs and MSM combined contribute up to 15% of new infections. • Highest proportion of new infections in western part of Kenya (Nyanza Province) 30% – most likely linked to lack of circumcision. • There is evidence of increased risk of HIV transmission in regular partners of sex workers, and regular partners of sex worker clients.
Recommendations • Kenya needs to conduct evaluations and more research on the: • Effectiveness of the abstinence, PMTCT and VCT programmes to determine their contribution to prevention. • Behaviour and mapping of most-at-risk, cultural issues requiring behaviour change, utilisation of services • Re-engineer the national response for a more rigorous and evidence-based prevention agenda that would ensure informed investment, address variations of epidemics in regions. reform policies to ensure maximum coverage of the response. • Re-focus and strengthen the prevention agenda to couples/partners, youth, MSM, IDUs, fishing communities, SWs and other most-at-risk populations as well as programmes that target prevention with positives. • Strengthen partnerships for consolidation of resources and capacities as well as the “Three Ones”