Download
1 / 36
360 likes | 479 Views
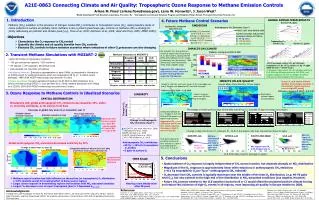
INTERCONTINENTAL TRANSPORT OF TROPOSPHERIC OZONE AND PRECURSORS AT NORTHERN MIDLATITUDES: IMPLICATIONS FOR SURFACE AIR QUALITY AND GLOBAL CHANGE. Daniel J. Jacob, Arlene M. Fiore, Qinbin Li, Loretta J. Mickley Atmospheric Chemistry Modeling Group Harvard University.

E N D
INTERCONTINENTAL TRANSPORT OF TROPOSPHERIC OZONE AND PRECURSORS AT NORTHERN MIDLATITUDES:IMPLICATIONS FOR SURFACE AIR QUALITY AND GLOBAL CHANGE Daniel J. Jacob, Arlene M. Fiore, Qinbin Li, Loretta J. Mickley Atmospheric Chemistry Modeling Group Harvard University
OZONE TREND AT EUROPEAN MOUNTAIN SITES, 1870-1990 Marenco et al. [1994] Preindustrial ozone models }
1980-1984 1994-1998 1980-1984 1994-1998 SURFACE OZONE IN U.S. INCLUDES A 20-40 ppbv BACKGROUND THAT HAS INCREASED BY ~3 ppbv OVER THE PAST 20 YEARS 8-h daily maximum ozone probability distribution at rural U.S. sites [Lin et al., 2000]
THIS OZONE BACKGROUND IS A SIZABLE INCREMENT TOWARDS VIOLATION OF U.S. AIR QUALITY STANDARDS(even more so in Europe!) Europe (8-h avg.) Europe (seasonal) U.S. (8-h avg.) U.S. (1-h avg.) 0 20 40 60 80 100 120 ppbv preindustrial present background
Simulated increase in mean U.S. surface ozone (ppbv) from tripling of Asian emissions (1985 to 2015)with other emissions held constant Enough to offset the benefits of 25% reductions in domestic emissions! Jacob et al. [1999]
GEOS-CHEM global model of tropospheric chemistry(www-as.harvard.edu/chemistry/trop/geos) • assimilated meteorological data from NASA DAO, 1988-2001 • 1ox1o- 4ox5o horizontal resolution, 20-48 layers in vertical • used by groups at Harvard, Duke, U. Washington, Rutgers, JPL, BNL, EPFL, Toulouse, Aquila; standard versions and benchmarks maintained at Harvard RECENT AND CURRENT APPLICATIONS: • Tropospheric ozone : global budget, Asian outflow, U.S. air quality, Middle East, transatlantic transport, tropics (TOMS), interannual variability, trends • Carbon monoxide: global and regional budgets, interannual variability • Aerosols: sulfate-organics-dust-sea salt • Stratospheric ozone: coupling with troposphere • Carbon dioxide: source/sink information from correlations with chemical tracers • Organics: budgets of hydrocarbons, oxygenated organics, nitriles, methyl halides • Satellite retrievals, inversions, chemical data assimilation: CO, CO2, ozone, formaldehyde, NO2 • Chemical forecasting: TRACE-P
SUMMER 1995 AFTERNOON OZONE IN SURFACE AIR Fiore et al. [2001] AIRS observations GEOS-CHEM (r2 = 0.4, bias=3 ppbv) “Background ozone” produced outside the North American boundary layer contributes 15-35 ppbv to mean surface air concentrations in the model
OZONE BACKGROUND OVER U.S. IS GENERALLY DEPLETED DURING REGIONAL POLLUTION EPISODESdue to deposition and chemical loss under stagnant conditions Observed (J.W. Munger) model (GEOS-CHEM) model background O3 vs. (NOy-NOx) At Harvard Forest, Massachusetts Background (clean conditions) Background (pollution episodes) Fiore et al. [2001] Pollution coordinate
RANGE OF ASIAN/EUROPEAN POLLUTION SURFACE OZONE ENHANCEMENTS OVER THE U.S. IN SUMMERasdetermined from a simulation with these emissions shut off Subsidence of Asian pollution + local production Max Asian/European pollution enhancements (up to 14 ppbv) occur at intermediate ozone levels (50-70 ppbv) stagnation tropical air MAJOR CONCERN IF OZONE STANDARD WERE TO DECREASE! Fiore et al. [2001]
NORTH AMERICAN OZONE OUTFLOW IN SURFACE AIR (GEOS-CHEM model results for 1997) APRIL L H L JULY H Li et al. [2001]
ORIGIN OF SURFACE OZONE AT BERMUDA IN SPRING (S. Oltmans) Production over U.S. is the dominant source of ozone at Bermuda; stratosphere contributes less than 5 ppbv Li et al. [2001]
EFFECT OF NORTH AMERICAN SOURCESON VIOLATIONS OF EUROPEAN AIR QUALITY STANDARD (55 ppbv, 8-h average) GEOS-CHEM model results, summer 1997 Number of violation days (out of 92) # of violation days that would not have been in absence of N.American emissions Li et al. [2001]
Observed [Simmonds] OZONE DATA AT MACE HEAD, IRELAND Model vs. observed stats, 1993-1997 Time series, Mar-Aug 1997 GEOS-CHEM model N.America pollution events in model Li et al. [2001]
FORECASTING TRANSATLANTIC TRANSPORT OF NORTH AMERICAN POLLUTION TO EUROPE FROM THENORTH ATLANTIC OSCILLATION (NAO) INDEX NAO index = normalized surface P anomaly between Iceland and Azores NAO Index North American ozone pollution enhancement At Mace Head, Ireland (GEOS-CHEM model) r = 0.57 Li et al. [2001] Greenhouse warming a NAO index shift a change in transatlantic transport of pollution
SURFACE OZONE ENHANCEMENTS CAUSED BYANTHROPOGENIC EMISSIONS FROM DIFFERENT CONTINENTS GEOS-CHEM model, July 1997 North America Europe Asia Li et al. [2001]
INTERCONTINENTAL TRANSPORT EXPERIMENT – NORTH AMERICA (INTEX-NA) Revised white paper, Nov 2001 (H.B. Singh, D.J. Jacob, L. Pfister) OBJECTIVES: • To quantify the North American import and export of (1) atmospheric oxidants and their precursors, (2) aerosols and their precursors, (3) long-lived greenhouse gases • To relate this import/export to surface sources/sinks and to continental boundary layer chemistry TWO AIRCRAFT:NASA DC-8 and P-3 • TWO PHASES: • Summer 2004: • active photochemistry, biosphere • aerosol radiative forcing • carbon uptake • Spring 2006: • maximum Asian inflow • contrast with summer
INTEGRATION OF AIRCRAFT OBSERVATIONS WITH SATELLITE DATA AND MODEL INFORMATIONIS CRITICAL TO THE OBJECTIVES OF INTEX-NA SATELLITE OBSERVATIONS Global and continuous but few species, low resolution Source/sink inventories 3-D CHEMICAL TRACER MODELS SURFACE OBSERVATIONS high resolution but spatially limited Assimilated meteorological data AIRCRAFT OBSERVATIONS High resolution, targeted flights provide snapshots with optimized information Chemical and aerosol processes U.S IMPORT/EXPORT
INTEX NOMINAL FLIGHT TRACKS FOR PHASE A (SUMMER) RL BG WL AZ DR BR NO HI DC-8 P-3B Ozonesonde sites
MOPITT validation: 40N, 132W 0226 at 2005Z; double spiral bracketing in time the MOPITT overpass. Solid stratus deck with tops at 3.5Kft, otherwise clear sky. Layer at 4-7 km is aged Asian pollution. DC-8 CO data (Sachse)
ATMOSPHERIC COLUMNS OF NO2 AND FORMALDEHYDE (HCHO) MEASURED FROM GOMEBY SOLAR BACKSCATTERALLOW MAPPING OF NOx AND HYDROCARBON EMISSIONS GOME Tropospheric NO2 column ~ ENOx Tropospheric HCHO column ~ ENMHC ~ 2 km hn (420 nm) BOUNDARY LAYER hn (340 nm) NO2 NO HCHO CO OH hours O3, RO2 hours NMHC 1 day HNO3 Emission Deposition Emission NITROGEN OXIDES (NOx) NON-METHANE HYDROCARBONS
CAN WE USE GOME TO ESTIMATE NOx EMISSIONS?TEST IN U.S. WHERE GOOD A PRIORI EXISTS Comparison of GOME retrieval (July 1996) to GEOS-CHEM model fields using EPA emission inventory for NOx GOME GEOS-CHEM (EPA emissions) BIAS = +3% R = 0.79 Martin et al. [2001]
GOME RETRIEVAL OF TROPOSPHERIC NO2vs. GEOS-CHEM SIMULATION (July 1996) Martin et al. [2001] GEIA emissions scaled to 1996
FORMALDEHYDE COLUMNS FROM GOME:July 1996 means Palmer et al. [2001] BIOGENIC ISOPRENE IS THE MAIN SOURCE OF HCHO IN U.S. IN SUMMER
GOME DETECTS THE ISOPRENE “VOLCANO” IN THE OZARKS Palmer et al. [2001]
DEPENDENCE OF GOME HCHO COLUMNSOVER THE OZARKS ON SURFACE AIR TEMPERATURE Temperature dependence of isoprene emission (GEIA) Palmer et al. [2001b]
MAPPING OF ISOPRENE EMISSIONS FOR JULY 1996 BY SCALING OF GOME FORMALDEHYDE COLUMNS [Palmer et al., 2001b] GOME COMPARE TO… GEIA (IGAC inventory) BEIS2 (official EPA inventory)
1750-2000 radiative forcing from tropospheric ozoneis less well constrained than implied by IPCC 2001 report Global simulation of late 19th century ozone observationswith the GISS GCM Standard model: DF = 0.44 W m-2 “Adjusted” model (lightning and soil NOx decreased, biogenic hydrocarbons increased): DF = 0.80 W m-2 [Mickley et al., 2001]
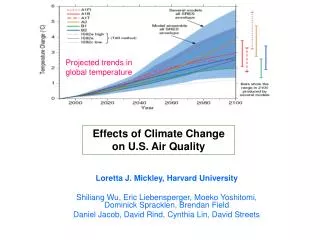
GLOBAL MEAN TEMPERATURE CHANGE SINCE 1750 DRIVEN BY MODEL TROPOSPHERIC OZONE CHANGE and compared to temperature changes from equal radiative forcings (0.45 W m-2) by uniformly mixed ozone and CO2 (GISS GCM 2’) Compared to an equivalent CO2 radiative forcing, tropospheric ozone gives less tropospheric warming and more stratospheric cooling CO2 Uniform ozone Ozone Loretta Mickley, In preparation
ONGOING WORK AT HARVARD FOR PHASE I OF OAR/OAQPS CLIMATE CHANGE MODELING INITIATIVE(Arlene Fiore, Brendan Field, Daniel Jacob, David Streets) • OBJECTIVE: Determine the global impacts of future changes in anthropogenic emissions on • surface ozone in N. America, Europe, and Asia; • surface ozone background; • tropospheric oxidizing capacity; • radiative forcing (CH4 and O3). • APPROACH:Conduct global GEOS-CHEM simulations with • 50% global reductions in emissions; • realistic future emission scenarios • Simulations are for 7/94-12/95 (first 6 mos. for initialization) with 4ox5o resolution
IMPACTS OF 50% REDUCTIONS IN ANTHROPOGENIC EMISSIONS 4ox5o GEOS-CHEM model results for JJA 1995
GLOBAL MODEL LIMITATIONS FOR SIMULATIONS OF REGIONAL OZONE POLLUTION:Comparison of GEOS-CHEM (2ox2.5o) and MAQSIP (40x40 km2)spatial statistics of summer means over eastern U.S. for summer 1995
Varimax rotated EOFs for surface ozone: summer afternoon 1995 AIRS observations on 2ox2.5o grid - cold fronts - southeast stagnation - midwest anortheast
Varimax rotated EOFs for surface ozone: summer afternoon 1995 GEOS-CHEM model results Correlation with EOFs derived from observations
NEXT STEP: NESTING OF GEOS-CHEM WITH MODELS-3collaboration with OAQPS and ORD • One-way nesting: use GEOS-CHEM global model fields as time-dependent boundary conditions for simulation of ozone, aerosols, and their precursors in Models-3 • First application: Texas 2000 field campaign • Two-way nesting: develop better simulation of regional effects on global atmospheric chemistry
SOME ISSUES FOR PHASE II OF OAR/OAQPS CLIMATE CHANGE MODELING INITIATIVE • How can we develop an accurate modeling framework to address consistently local surface air quality and global change issues? • Development of nested models • How can we extract information from satellite observations on intercontinental transport of pollution? • Integration with in situ observations and models, development of inverse modeling tools • How does photochemical coupling between aerosols and chemistry affect assessments of emission changes on surface air quality and global change issues? • Development of coupled aerosol-chemistry models