Download
1 / 46
460 likes | 539 Views
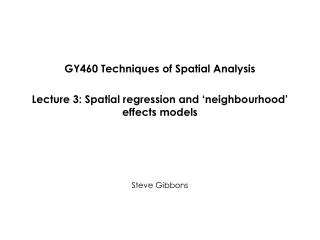
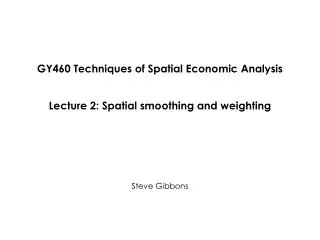
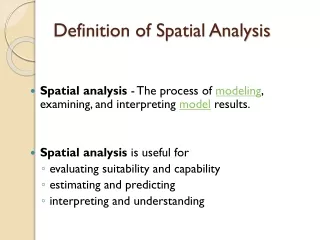
GY460 Techniques of Spatial Analysis. Lecture 7: Measures of Inequality, Concentration and Segregation. Steve Gibbons. Introduction. Many situations where we want summary statistics that characterise the distribution of a characteristic across data units e.g.

E N D
GY460 Techniques of Spatial Analysis Lecture 7: Measures of Inequality, Concentration and Segregation Steve Gibbons
Introduction • Many situations where we want summary statistics that characterise the distribution of a characteristic across data units e.g. • Number of industries in different regions • Income across individuals • Crime rates across wards • Proportion in the population non-white in different wards • This lecture discusses the use of these indices in relation to spatial patterns
Cumulative distribution function • Basic statistical concept: • With a random variable that takes on discrete values, an estimate is 1 0.8 0.6 0.4 0.2 0 100 200 300 400
Lorenz curve • Commonly used to describe inequality (e.g. income) • With a random variable that takes on discrete values, an estimate is
Lorenz curve L(x) 1 0.8 0.6 0.4 0.2 0 0.2 0.4 0.6 0.8 1 F(x)
Segregation curve • This is a variant of the Lorenz curve that is appropriate when considering inequality in proportions • E.g. white/non-white • Suppose we are interested in ethnic segregation. Should we consider whites or non whites? • Lorenz curve gives different results • Segregation curve base on comparing cumulative contribution of each unit (school, ward, district, firm etc.) to total white or non-white
‘White’ Lorenz curve L(w) 1 0.8 0.6 0.4 0.2 0 0.2 0.4 0.6 0.8 1 F(x) Note: here, sum(white) = 2
‘Non-white’ Lorenz curve L(nw) 1 0.8 0.6 0.4 0.2 0 0.2 0.4 0.6 0.8 1 F(x) Note: here, sum(nonwhite) = 3
Segregation curve L(nw) 1 0.8 0.6 0.4 0.2 0 0.2 0.4 0.6 0.8 1 L*(w) Note: units are ranked by nw here
Indices • All the useful information about the distributions is contained in the Cumulative/Lorenz/Segregation curves plus the mean • But useful to be able to summarize the features of the these distributions using single numbers • Indices intended to rank distributions in study areas/periods according to the inequality • Unfortunately no single index provides a complete summary
Generalised entropy family • Many commonly used indices have the same general form • Indices of this form have the key properties of scale invariance and decomposability • Sale invariance means that x and x give same index • units of measurement or inflation don’t matter for income inequality • Decomposability means that index is a weighted sum of the indices for sub-groups of the population • e.g. regions
Coefficient of variation • For beta = 2, gives half-squared coefficient of variation • So • (where “sample variance” is the 1/n version )
Herfindahl • This is closely related to the Herfindahl index • Which is often used to measure industrial concentration
Theil index • Another commonly used index is the Theil Index • Which corresponds to the generalised entropy measure case when 1
Additive decomposability • Good thing about CV (squared), theil index and generalised entropy is that they can be decomposed into sub-groups • E.g. suppose we have K regions with index Ik. Then the total inequality Itotal can be written as a sum of within region and between region indices • Where wk is a region-specific weight which depends on the regional share of total x • (In the generalised entropy case it can be shown that)
Gini index • The GINI isn’t a member of the generalised entropy family • GINI is twice area between the Lorenz curve and the 45 degree line (equality across data units) • Computed in practice using (when units are same size)
Gini index 0.5 x Gini Lorenz curve
Gini index for household incomes in Britain Source: Poverty and Inequality in Britain 2005, IFS, London
Indices for categorical variables • Gini, generalised entropy family can be used when interest is on a categorical variable e.g.: • Black/white, industrial classification • Though problem with asymmetry c.f. Lorenz curves for white/non-white shown earlier • Various “Segregation” indices often used to describe distribution of categorical variables • Measure inequality in one group relative to “other” group or total • “Benchmark” is same proportion of each group in each data unit (e.g. regions) • All have been re-invented many times
Dissimilarity index • Used for measuring distribution of some group j across units of aggregation i • e.g.
Dissimilarity index • Dissimilarity ranges between 0 (all units the same) and 1 (units are either all group j or zero group j) e.g.
Dissimilarity index • Indicates the proportions of one group that would have to re-locate to generate no segregation 200 600
Dissimilarity index • One problem is that it isn’t scale invariant, i.e. sensitive if there are proportional changes in one group
Segregation index • Same purpose: all that’s different is that the comparison with total numbers in unit i, not numbers that are not in the j group • e.g. • The “Krugman” index is just 2 x this, using employment or GDP • Sepcialisation of place i: i as geographical units, j as industries • Concentration of industry j: j as geographical units, i as industries
Segregation/Krugman index • Not sensitive to proportional changes in the group of interest
Segregation/Krugman index • But upper bound varies with total proportion in group • It is (1 - proportion in group j) * D
Isolation index • Measures the probability that random minority group member (e.g. black) shares a unit with another minority member; rather sensitive to overall share
Isolation index • Modified by Cutler, Glaeser, Vigdor (Journal of Political Economy 1999) to allow for overall minority group size divide by the maximum value to scale between 0-1
Isolation index • The CGV version
“Spatial” indices • All the indices discussed measure inequality between data units so are spatial only if the data units are regions, districts or other spatial units! • No measure here of how data is distributed within units • E.g. all poor residents live in one part of the district • Or whether there are spatial patterns across units • e.g. all the majority poor districts next to each other • Some indices try to take account of these factors • See Massey and Denton (1988) or White (1983), The Measurement of Spatial Segregation, AJS, 88: 1008-1019 • Echinique and Fryer (2005), On the Measurement of Segregation, NBER W11258
Ethnic segregation indices in English secondary schools Source: Burgess and Wilson 2003
US segregation and black white test gap Source: Vigdor and Ludwig 2007, NBER Working Paper W12988
Segregation indices are descriptive! • Remember that segregation indices are descriptive statistics! • Usual rules apply about inferring causality • See Hoxby (2000) on reading list for example of attempt to use similar indices for ‘causal’ analysis • Uses numbers of rivers in US metropolitan areas as instrument for market fragmentation in schooling
Another “segregation” index • Variation on a theme: square the difference rather than take absolute difference • I.e. it’s the squared difference between the contribution of unit i to total of j and contribution of i to overall total (or other comparison group) • Can be used measuring concentration due to agglomeration forces? • Ellison and Glaeser (1997) develop this index…
Another “segregation” index • The G index • Sometimes called “Gini”; though Gini here is (by one calculation) = 0.23
The Ellison and Glaeser Index • …But not possible to distinguish industrial concentration caused by market concentration (a few large plants) from agglomerative forces (many small plants co-located) • E + G (Journal of Political Economy 1997) correct the index to allow for this • Requires plant-level Herfindahl for industry j: Hj
US: 446/449 industries more concentrated than expected. State-level data
Industrial location • See the further readings on the list: • Holmes, T And J. Stevens (2004) The Spatial Distribution Of Economic Activates In North America Handbook Of Urban And Regional Economics, Volume 4, Jacques Thisse And Vernon Henderson (Eds.) • Combes, P. P. And H. G. Overman (2004) The Spatial Distribution Of Economic Activities In The EU Handbook Of Urban And Regional Economics, Volume 4, Jacques Thisse And Vernon Henderson (Eds.)
References • Cutler, DM, Glaeser, EL and Vidgor, JL (1999), The rise and decline of the American ghetto, Journal of Political Economy, 107(3): 455-506 • Burgess, S and D. Wilson (2003) Ethnic Segregation in Englands Schools, CMPO Working Paper 03/086 • Ellison, G. and E. Glaeser (1997) Geographic Concentration in US Manufacturing Industries: A Dartboard Approach, Journal of Political Economy 105 (5) 889-927