Download
1 / 47
500 likes | 868 Views
GY460 Techniques of Spatial Analysis. Lecture 5: Exploratory analysis of spatial patterns. Steve Gibbons. Introduction. Suppose we want to know A) Are there spatial patterns? Are there clusters of manufacturing productivity? Are their crime clusters?

E N D
GY460 Techniques of Spatial Analysis Lecture 5: Exploratory analysis of spatial patterns Steve Gibbons
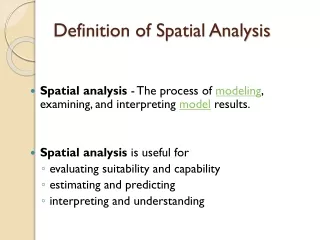
Introduction • Suppose we want to know • A) Are there spatial patterns? • Are there clusters of manufacturing productivity? • Are their crime clusters? • Various global spatial statistics available to answer this • Suppose we want to know • B) Which places generate these spatial patterns? • Where are there clusters of manufacturing productivity? • Where are their crime clusters? • We need local indicators • Descriptive statistics – “Exploratory Spatial Data Analysis”
‘Mean’ v ‘covariance’ v ‘density’ methods • Three general classes of methods • Methods that are based on local means amongst neighbouring events: we’ve looked at these already – see the ‘smoothing’ lecture e.g. • Kernel regression, Interpolation • Methods that are based on local covariances between neighbouring events e.g. • Moran’s I (global) • Local Indicators of Spatial Association (LISA) - Local Moran’s I • Methods that are based on the density of events or things • Kernel density estimates, distance based measures: Ripley’s K, Durnaton and Overman’s K-density
Spatial autocorrelation • Assume places (regions, districts, firms people etc) are fixed • Variable (x) recorded at places s • Is the data x random across space or are there similarities between neighbours? • Does a high value of x tend to be associated with a high value of x in neighbouring places (and low values with low)?
Gobal indicators • ‘Is there spatial autocorrelation’? • Global indicators of spatial association provide the answer • E.g. Moran’s I • Where I’ve used ~ to indicate deviations from mean
LISA • ‘Where is the spatial autocorrelation’? • Local indicators of spatial association (LISA) provide answer • Anselin (1995) definition: LISA • Indicates spatial clustering of similar values around the observation • Sum of LISAs proportional to a Global indicator
Local Moran I • Local Indicator (Local Moran I) • Product of (centred) x and ‘neighbouring’ x at place i • Divided by the variance of x • Note: mean of Local = Global
Local Moran I 5 4 1 2 3
LISA are map-able: regional convergence Source: Rey, S and B. Montouri, US Regional Economic Convergence: A Spatial Econometric Perspective, Regional Studies, 33 (2) 143-156
Moran scatter-plot • See Anselin (1995, Local Indicators of Spatial Association , Geographical Analysis) • This is just a graph of ‘average neighbourhood’ x (Wx) • against x • Or use standardised values • E.g. from Anselin (1995) • Conflict in African countries 1966-78
Moran scatter-plot: components of spatial autocorrelation Li - Low-high Li + High-high Wx 0 Li - High-low Li + Low-low 0 x
Outliers: boundary areas cause problems (edge effects) Sudan Egypt
Example: London crime data • Burglary rates, 2001. Global I = 0.624
Local Moran I Map Not-significant High-High Low-Low Low-High High-Low ?
Local Moran Significance Map Not-significant P=0.05 P=0.01 P=0.001 P=0.0001 ?
LISA – Hypothesis tests • H0: no spatial clustering at point i • Use analytical standard errors • e.g. see Anselin (1995) (map room) • Or Fortheringham chapter on Local Analysis • Or simulate null distribution by random re-assignment • LISA are specific to each observation (place) • Z-statistics or p-values are specific to each observation
LISA – Hypothesis tests • If we have n observations we have • n tests, n z-statistics, n p-values • One test statistic has p-value p • Probability of observing a significant test amongst n independent tests is • High probability of ‘Type I’ error • Wrongly reject Null of no clustering
LISA – Hypothesis tests • Need Bonferroni correction • Significance level = , z statistic p-value = p • Corrected p-value is n*p • Test at /n • Conservative if data is spatially correlated because the tests are correlated • Probability of observing significant test statistic by chance under H0 is
Example: Growth in London crime • Growth in burglary rates, 1999-2002. Global I = 0.328
Local Moran I z-scores • Z(0.05) = 1.96, no correction • Z(0.05) = 3.77, bonferroni correction (634 wards) ?
Conclusions on LISA • Local Moran’s I (and other LISA) useful for showing places where significant spatial autocorrelation exists • Purely descriptive • Though potential to combine with regression analysis for further analysis • Residuals? • Dependent variable?
Introduction • Spatial autocorrelation analysis tell us about similarities/dissimilarities in the characteristics of neighbouring places • Typically zonal aggregated data, or characteristics related to objects that are treated as fixed in space • Point pattern analysis looks for patterns in the spatial location of events • “Events” are assigned to points in space • e.g. infection by bird-flu, site where firm operates, place where crime occurs, redwood seedlings • Some parallels: e.g. if we aggregate crime events to zones we get zonal crime rate data • Point pattern analysis has the advantage that it is not directly dependent on zone definitions (MAUP)
Spatial point patterns Aggregated Random
Spatial point patterns Regular
Complete Spatial Randomness • The simplest “null hypothesis” regarding spatial point patterns • The number of events N(A) in any planar region A with area |A| follows a Poisson distribution with mean: • Given N(A)= n, the events in A are an independent random sample from the uniform distribution on A • Poisson process has constant “intensity” • Intensity is the expected number of events per unit area • Also mean = variance See Diggle p.47
Grid based approaches • Divide area up in to grids (area and calculate observed “intensity” at each grid square (number of obs divided by area) • Tests for CSR based on grid counts G={g1,g2,…} • Under CSR, independent identically Poisson distributed with mean • Do point counts G follow Poisson distribution? Use mean=variance property • Under CSR E[I]=1; >1 implies aggregation; <1 implies dispersion • But what size grid?
Testing for CSR • CSR not particularly useful “null hypothesis” for economic/geographic processes • e.g. we wouldn’t want to test firm localisation against this assumption (why?) • But useful starting point • Other benchmarks preferable – e.g. distribution of manufacturing firms as the ‘null hypothesis’ in Marcon and Pruech (2003), Duranton and Overman (2005)
Kernel intensity/density estimates • Space is continuous. • Grid squares approaches give discontinuous estimate based on arbitrary grid • More general approach: kernel intensity estimates • k(.): kernel weighting function (a bivariate probability density function) • h: bandwidth - higher bandwidth increases bias, but reduces variance; somewhat arbitrary though methods available for optimal bandwidth choice • s: grid point • si: data points
Kernel intensity/density estimates • A simple kernel intensity estimate using a “uniform” kernel 2 = 0.716
Kernel intensity/density • Note: technically the kernel density is • So that adding up over the sample points, the density sums to 1 • Sometimes (e.g. GIS) the intensities are referred to as densities
Edge effects R2 x R1 y
Correcting edge effects • Intensity estimated lower at point y than at point x • Corrections can be based on • % area of circle within R1 • % circumference of circle within R1 • [circumference easier to calculate] • drawing buffer zones
K function • The “K function” is the expected number of events within distance d of an event, divided by mean intensity in the study area (i.e. number of events/ area)
Ripley’s K • Ripley’s (1976) estimator of K • Where |A| means area of study area A, and means distance between s_i and s_j • Also need to take care of edge effects • If events uniformly distributed with intensity then expected number of events within distance d is d2 • So expected K(d) under uniform distribution (CSR) is d2
Ripley’s K d=1m 5m 5m If uniform K(1) = = 3.14
Checking for clustering • Under CSR with uniform intensity expect K(d) K d
Hypothesis tests • Sampling distribution of these spatial point process statistics is often unknown • Possible to derive analytical point-wise confidence intervals for kernel estimates • But more generally use “monte-carlo”, “bootstrap” and random assignment methods
Postscript 1: GWR • Sometimes we’d like to know about variation in regression parameters over space • One technique: Geographically Weighted Regression • To get the parameters at place s0, estimate weighted least squares regression, i.e. OLS on: • Where the weight on each observation wi0 decreases with distance from place s0 • See Fotheringham Chapter 5, and/or Brunsdon et al, 1998, Geographically Weighted Regression – Modelling Spatial Non-stationarity, The Statistician, Vol. 47, no. 3.