Download
1 / 19
190 likes | 392 Views
Gap Analysis: GIS, maps and a new view of regional conservation. Kathryn Thomas U.S. Geological Survey Southwest Biological Science Center. Southwest Regional GAP Project Arizona, Colorado, Nevada, New Mexico, Utah.

E N D
Gap Analysis: GIS, maps and a new view of regional conservation Kathryn Thomas U.S. Geological Survey Southwest Biological Science Center Southwest Regional GAP Project Arizona, Colorado, Nevada, New Mexico, Utah US-IALE 2004, Las Vegas, Nevada: Transdisciplinary Challenges in Landscape Ecology
What is a gap? A “gap” is the lack of representation or under-representation of vegetation types or vertebrate species, the biotic elements of biological diversity, on lands managed for conservation How do we analyze gaps? Gap analysis identifies the gaps through a spatial analysis. The land cover map is intersected with the stewardship map and the vertebrate habitat maps are intersected with the stewardship map. What is the fundamental assumption? The best time to ensure a biotic element (vegetation types or vertebrate species) does not become endangered is while it is still relatively common. GAP does not determine what is adequate representation for the biodiversity elements.
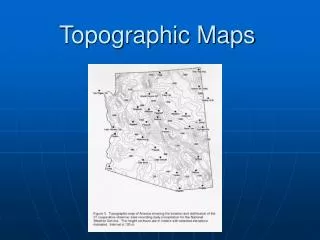
Five steps to identifying conservation gaps • Map land cover • Map vertebrate species distribution • Map land stewardship and management status • Conduct the gap analysis • Make map products and gap analysis results available and facilitate their implementation
The process The products Summary tables Total mapped area of each biodiversity element in different land stewardship and management status categories Representation of biotic element with respect to management status 0 - <1% 1 - < 10% 10 - < 20% 20 - < 50% > = 50%
Land stewardship Management status How much biotic conservation lands exist for the study area and who manages them?
Land stewardship/Management status: Example from first generation New Mexico GAP
Land cover (ecological systems) Land Stewardship/Management status Who are the stewards of the ecological systems? How is each ecological system represented among the management status categories?
Land cover/Land stewardship: Example from first generation New Mexico GAP
Land cover/Management status: Example from first generation New Mexico GAP
Vertebrate Species Predicted Habitat Land stewardship/Management status Who are the stewards of vertebrate habitat? How is each vertebrate habitat represented among the management status categories?
Vertebrate habitat/Management status: Example from first generation New Mexico GAP
Vertebrate habitat/Land stewardship: Example from first generation New Mexico GAP
Where are the protected lands in relationship to the distribution of the vegetation types and vertebrate species?
Spatial view of land cover: Example from first generation Wyoming GAP Saltbush Fans & Flats Protected lands % distribution on BLM: 81% % protected statewide: 0.5% % BLM protected: 0.0%
Spatial view of a vertebrate habitat: Example from first generation New Mexico GAP Who are the land stewards? % USFS: 53.0% % BLM: 0.85% How well is the Grace’s Warbler protected? Only 7.3% is predicted to occur in protected (1&2) areas
Does not specifically assess habitat quality • Should not replace for intensive local inventories or single species diversity planning • Is not a nationwide inventory of biological resources • Does not provide an accuracy assessment of analysis results • Does not account for historic losses in range/aerial extent • Does not predict biotic element variability Limitations of gap analysis
Unique features of a gap analysis • Provide information on common and/or ordinary species • Provide quantitative data on the biotic elements of an area • Provides data throughout the range of a vertebrate species or vegetation type • Can be done on local, state, regional or national extent
SWReGAP • Stewardship • Management status • Stewardship of ecological types • Management status of ecological types • Stewardship of vertebrate habitat • Management status of vertebrate habitat
Gap analysis and conservation planning • Are biotic elements well represented within protected (status 1 and 2) lands? • What conservation opportunities exist on status 3 managed lands? • What opportunities exist for private landowners to contribute to conservation of biotic elements?