Population Growth Models
Population Growth Models. Ro – Net Reproductive Rate. Spruce Budworm. Spruce Budworm. Budworm defoliation. Northern Elephant Seal. Reduced to about 20 by 1890’s Model of exponential recovery predicted 80 seals by 1906; 40,960 seals by 1978

Population Growth Models
E N D
Presentation Transcript
Spruce Budworm Budworm defoliation
Northern Elephant Seal • Reduced to about 20 by 1890’s • Model of exponential recovery predicted 80 seals by 1906; 40,960 seals by 1978 • Real data – 125 seals in 1911; 60,000 seals in 1977
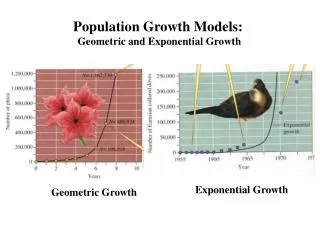
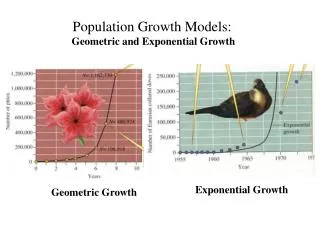
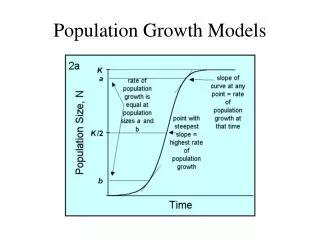
Because exponential growth is seldom seen, population growth must be constrained - two types of constraints 1) density independent constraints - growth constraints that are not effected by population size - usually abiotic - weather, storms, volcanos 2) density dependent constraints - growth constraints whose effects change as population size increases - usually biotic - competition, predation, parasitism, disease
Assumptions for logistic growth equation 1. The population initially has a stable age distribution – the SAD assumption. 2. The density of the population has been measured in the proper units. - have we included all age or size classes? 3. The relationship between density and the rate of increase is linear. – each individual has same effect on r. 4. The depressive influence of density on the rate of increase operates instantaneously without any time lags.
Reasons natural population growth may not fit logistic growth models 1. In nature, each individual added to the population does not cause an incremental increase to r 2. In nature, there are often time lags in growth, especially in species with complex life cycles - mammals may be pregnant for months before giving birth 3. In nature, K may vary seasonally or with climate 4. In nature, often a few individuals command many matings 5. In nature, there are few barriers preventing dispersal
General rules about population growth 1. There is a strong correlation between size and generation time in organisms such that small organisms have shorter generation times than large organisms - this is true for organisms from bacteria to whales 2. Organisms with longer generation times have lower per-capita rates of population growth 3. Therefore, larger animals have lower rates of increase, r. For any given size, endotherms have a higher rate of increase than do ectotherms, which in turn have a higher rate of increase than do unicellular organisms