Download
1 / 48
480 likes | 639 Views
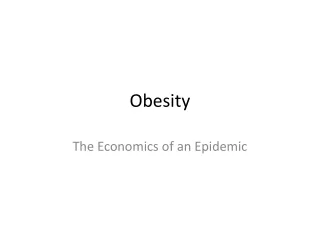
REDUCING OBESITY. Carolyn L. Engelhard, MPA Assistant Professor & Health Policy Analyst University of Virginia School of Medicine February 1, 2011. Policy Strategies from the Tobacco Wars. The growing prevalence of obesity over time. Obesity Trends* Among U.S. Adults BRFSS, 1986.

E N D
REDUCING OBESITY Carolyn L. Engelhard, MPA Assistant Professor & Health Policy Analyst University of Virginia School of Medicine February 1, 2011 Policy Strategies from the Tobacco Wars
Obesity Trends* Among U.S. AdultsBRFSS, 1986 No Data <10% 10%–14 (*BMI ≥30, or ~ 30 lbs. overweight for 5’ 4” person) Source: CDC Behavioral Risk Factor Surveillance Summary; http://aps.nccd.cdc.gov/brfss
Obesity Trends* Among U.S. AdultsBRFSS, 1987 No Data <10% 10%–14 (*BMI ≥30, or ~ 30 lbs. overweight for 5’ 4” person) Source: CDC Behavioral Risk Factor Surveillance Summary; http://aps.nccd.cdc.gov/brfss
Obesity Trends* Among U.S. AdultsBRFSS, 1988 No Data <10% 10%–14 (*BMI ≥30, or ~ 30 lbs. overweight for 5’ 4” person) Source: CDC Behavioral Risk Factor Surveillance Summary; http://aps.nccd.cdc.gov/brfss
Obesity Trends* Among U.S. AdultsBRFSS, 1990 No Data <10% 10%–14 15%–19% 20%–24% 25%–29% ≥30% (*BMI ≥30, or ~ 30 lbs. overweight for 5’ 4” person) Source: CDC Behavioral Risk Factor Surveillance Summary; http://aps.nccd.cdc.gov/brfss
Obesity Trends* Among U.S. AdultsBRFSS, 1991 No Data <10% 10%–14 15%–19% 20%–24% 25%–29% ≥30% (*BMI ≥30, or ~ 30 lbs. overweight for 5’ 4” person) Source: CDC Behavioral Risk Factor Surveillance Summary; http://aps.nccd.cdc.gov/brfss
Obesity Trends* Among U.S. AdultsBRFSS, 1992 No Data <10% 10%–14 15%–19% 20%–24% 25%–29% ≥30% (*BMI ≥30, or ~ 30 lbs. overweight for 5’ 4” person) Source: CDC Behavioral Risk Factor Surveillance Summary; http://aps.nccd.cdc.gov/brfss
Obesity Trends* Among U.S. AdultsBRFSS, 1993 No Data <10% 10%–14 15%–19% 20%–24% 25%–29% ≥30% (*BMI ≥30, or ~ 30 lbs. overweight for 5’ 4” person) Source: CDC Behavioral Risk Factor Surveillance Summary; http://aps.nccd.cdc.gov/brfss
Obesity Trends* Among U.S. AdultsBRFSS, 1995 No Data <10% 10%–14 15%–19% 20%–24% 25%–29% ≥30% (*BMI ≥30, or ~ 30 lbs. overweight for 5’ 4” person) Source: CDC Behavioral Risk Factor Surveillance Summary; http://aps.nccd.cdc.gov/brfss
Obesity Trends* Among U.S. AdultsBRFSS, 1996 No Data <10% 10%–14 15%–19% 20%–24% 25%–29% ≥30% (*BMI ≥30, or ~ 30 lbs. overweight for 5’ 4” person) Source: CDC Behavioral Risk Factor Surveillance Summary; http://aps.nccd.cdc.gov/brfss
Obesity Trends* Among U.S. AdultsBRFSS, 1997 No Data <10% 10%–14 15%–19% 20%–24% 25%–29% ≥30% (*BMI ≥30, or ~ 30 lbs. overweight for 5’ 4” person) Source: CDC Behavioral Risk Factor Surveillance Summary; http://aps.nccd.cdc.gov/brfss
Obesity Trends* Among U.S. AdultsBRFSS, 1998 No Data <10% 10%–14 15%–19% 20%–24% 25%–29% ≥30% (*BMI ≥30, or ~ 30 lbs. overweight for 5’ 4” person) Source: CDC Behavioral Risk Factor Surveillance Summary; http://aps.nccd.cdc.gov/brfss
Obesity Trends* Among U.S. AdultsBRFSS, 2000 No Data <10% 10%–14 15%–19% 20%–24% 25%–29% ≥30% (*BMI ≥30, or ~ 30 lbs. overweight for 5’ 4” person) Source: CDC Behavioral Risk Factor Surveillance Summary; http://aps.nccd.cdc.gov/brfss
Obesity Trends* Among U.S. AdultsBRFSS, 2001 No Data <10% 10%–14 15%–19% 20%–24% 25%–29% ≥30% (*BMI ≥30, or ~ 30 lbs. overweight for 5’ 4” person) Source: CDC Behavioral Risk Factor Surveillance Summary; http://aps.nccd.cdc.gov/brfss
Obesity Trends* Among U.S. AdultsBRFSS, 2002 No Data <10% 10%–14 15%–19% 20%–24% 25%–29% ≥30% (*BMI ≥30, or ~ 30 lbs. overweight for 5’ 4” person) Source: CDC Behavioral Risk Factor Surveillance Summary; http://aps.nccd.cdc.gov/brfss
Obesity Trends* Among U.S. AdultsBRFSS, 2004 No Data <10% 10%–14 15%–19% 20%–24% 25%–29% ≥30% (*BMI ≥30, or ~ 30 lbs. overweight for 5’ 4” person) Source: CDC Behavioral Risk Factor Surveillance Summary; http://aps.nccd.cdc.gov/brfss
Obesity Trends* Among U.S. AdultsBRFSS, 2005 No Data <10% 10%–14 15%–19% 20%–24% 25%–29% ≥30% (*BMI ≥30, or ~ 30 lbs. overweight for 5’ 4” person) Source: CDC Behavioral Risk Factor Surveillance Summary; http://aps.nccd.cdc.gov/brfss
Obesity Trends* Among U.S. AdultsBRFSS, 2006 No Data <10% 10%–14 15%–19% 20%–24% 25%–29% ≥30% (*BMI ≥30, or ~ 30 lbs. overweight for 5’ 4” person) Source: CDC Behavioral Risk Factor Surveillance Summary; http://aps.nccd.cdc.gov/brfss
More than 1 in 3 adults in the U.S. were obese by 2008 F as in Fat, 2009 http://healthyamericans.org/reports/obesity2009/Obesity2009Summary.pdf; National Center for Health Statistics, 2008
U.S. most obese country in the world 45% of U.S. adults are projected to be obese this year https://www.mckinseyquarterly.com/PDFDownload.aspx?ar=2687
Consequences of Obesity - Adults • Obesity is related to 20 chronic illnesses and results in 112,000 deaths/year in U.S. (2.6M globally) • U.S. spends $147 billion/year to treat obesity • In the U.S., every point of BMI >30 adds $300 in per capita HC costs • U.S. would save $200 billion/year if we weighed what we did in 1987 • 50% of obesity-related treatments paid for by Medicare or Medicaid For the first time since the Civil War, average life span may shrink because of obesity-related conditions
Consequences of Obesity - Kids • 10 million children and adolescents are obese • The average 10 year old weighed 77 lbs in 1963; today 88 lbs • 25% of all vegetables eaten in U.S. are french fries or chips • One out of four kids eat fast food at least once a day • Overweight adolescents have a 70% chance of becoming an obese adult Source: National Center for Health Statistics, 2006; Obesity in childhood is defined as BMI at 95th percentile or above
Consequences of Obesity – Kids and Sugared Drinks • Sugared beverages are the No. 1 source of calories in the American diet, representing 7% for adults and 10% for children and teenagers • 190 cal/day/capita come from sugared beverages -- 120 calories more than in late 1970s • Risk of becoming obese increases by 60% for pre-teens for every additional serving of sugar-sweetened beverage per day http://graphics8.nytimes.com/images/2010/02/14/weekinreview/14bittmann-grfk/14bittmann-grfk-popup.jpg
History of the success of tobacco control • Past 45 yrs, smoking rates have fallen -- 42.4% to 19.8% in 2007 • In 1964, Surgeon General Luther Terry appointed committee: Cigarette smoking is a health hazard of sufficient importance in the US to warrant appropriate remedial action. • What worked? • Most important, according to WHO: excise taxes • Broadcast bans • Public information campaigns • Banned smoking in mainly indoor places • Encouraged treatment modalities such as nicotine patches • Measures to prevent youth from accessing tobacco
Lessons from other countries Graphic, front-of-package labels cut Canadian tobacco use by 5% in one year, the largest one year drop in a decade
Similarities of tobacco and obesity • Chronic disease and premature death • Significant health care costs • History of aggressive marketing • Disproportionately represented in lower socio-economic strata • Social stigma • Same neurological pathways involved in addiction • Difficult to treat
Difference #1: Exercising can compensate for overeating , somewhat • 82% of obesity from excess calories • 18% by lack of exercise • Adolescent physical activity stable over time • Obesity the result of overeating rather than too little exercise
Difference #2: Only some food is unhealthy Researchers at Oxford University in UK developed a numerical nutrient “score” balancing a 100 gram serving of a food’s risky elements – calories, saturated fat, salt, and sugar – against the food’s nutritional benefits – fruit and vegetable content, fiber, and protein Used in UK, Australia, and New Zealand to ban advertising
Policy Interventions from the “Tobacco Wars” #1 : Advertising Bans • A study of 22 OECD countries found that comprehensive bans on tobacco advertising results in a 5-7% reduction in tobacco use • Food industry spends more on advertising than any other industry -- $30 Billion ($10B on kids) • Children and youth view 12-21 commercials/day for snack foods • More than 85% are for fattening food • 1/7th to 1/3rd of obesity in kids linked to food ads • Banning fast food advertising would reduce the number of overweight children by 18% and teenagers by 14%
Policy Interventions from the “Tobacco Wars” #2 : Clear and simple labeling • Half of American food budget spent on meals/snacks outside home • 33% of calories are from fast food restaurants • Restaurant fast food consumption = 800 more calories per day • Fast food patrons underestimate calories by half • In restaurant chains above a certain size, calories are required on menus and menu boards in Philadelphia, NYC, California, Maine, Massachusetts, and Oregon (nationwide beginning in 2011)
Policy Interventions from the “Tobacco Wars” #3: Front-of-package “signpost” labeling • Current nutrition “fact box” on foods can be confusing to consumers • Other countries use front of package signpost labels • Australia consumers 5x as likely to identify healthy foods w/ traffic light labels • Tesco stores (UK) showed a 41% drop in unhealthy food purchases after implementing “Front of Package” signpost system • The FDA is considering moving to a green, yellow,red“dot” system on foods
Policy Interventions from the “Tobacco Wars” #4: Taxing fattening food Sugar, rum and tobacco are commodities which are nowhere necessities of life, which are become objects of almost universal consumption , and which are therefore extremely proper subjects of taxation. Adam Smith, Wealth of Nations, 1776 The UK has a 17.5% tax on sugared and high-fat foods, France 19.6%, and Canada 5%
Reasons to tax unhealthy foods like sugared beverages • Reduce consumption – 10% (11 gal) w/ penny per ounce • Raise revenue – same penny = $10B/yr; $150B/10 yrs • Send message about dangers of fattening food • Correct market failure of externalities – costs borne by taxpayers • Enact personal responsibility – accountability for extra costs
Reasons against taxing unhealthy foods Disadvantages low income households • Inherent regressivity of the tax • Lack of access to affordable healthy food in some low-income communities; 5% of Americans have no car and live > ½ mile away from supermarket • Price – the big factor • Fattening food is cheaper, per calorie. $10 will buy 2 pkg of organic blueberries or a week’s worth of Mac and cheese
Tax subsidies for healthy foods • Taxes could be targeted to: • Increase food stamp allotment for fruits and vegetables • Support community-based initiatives to bring healthy, affordable food to low-income communities • Studies suggest that lower-priced fruits and vegetables will increase consumption of healthy foods and lower BMI for low-income kids • Revenues could subsidize health coverage for low-income people who lack health insurance
Are food taxes politically viable? • 40 states have modest taxes on sugared beverages and snacks • Although anti-tax, Americans may support taxes for specific reasons 53% favored tax on sugary drinks to finance reform, but increased to 83% support with “raise money for health care reform while also tackling the health problems that stem from being overweight” KFF Tracking Poll, June 2009
What we proposed in our study: new taxes 10% tax on Fattening Foods* as classified by the UK model * According to the UK “Rayner” model, 33% of foods would be subject to taxation based on their score of “less healthy”; we derived a 0.931 “own price elasticity” (the % by which consumption decreases in response to a 1% increase in price of the food) when calculating consumption post-tax
What we proposed in our study: food subsidies • For even more progress* reducing obesity, we combined the tax with a 10% subsidy to lower the cost of fruits and vegetables *Research from the UK suggests that a combination of taxes on unhealthy foods plus subsidies for healthy foods results in healthy eating consumption behavior
What we proposed in our study: food labeling After one year, red items decreased 5.3%, yellow increased 30.7%, and green rose 16.5%
What we proposed in our study: marketing changes • 50 countries regulate and/or ban unhealthy food advertising aimed at children • In the U.S., a comprehensive ban would confront a constitutional challenge, but restricting ads would help • Some cities have used pro-active marketing campaigns to educate the public about the dangers of unhealthy foods http://cityroom.blogs.nytimes.com/2009/08/31/new-salvo-in-citys-war-on-sugary-drinks/?scp=1&sq=soda%20fat%20sewell&st=cse
Conclusion: policy and politics • Recent decades’ increase in obesity was not caused by a change in human nature; it resulted from a change in the environment in which people make food choices • Just like with smoking, policy makers will need to change that environment • As with tobacco, the belief in individual liberty and the battle against the industries that benefit from the sale of unhealthy foods will make changing the environment difficult
Aggressive public policy interventions used to reduce tobacco use could be used in fighting obesity • Imposing excise or sales taxes on fattening foods of little nutritional value • Putting graphic, simple labels on the front of packaged foods showing nutritional value • Requiring restaurant chains to put simple nutrition information on the menu next to item (enacted in PPACA; compliance required by end of 2011) • Restricting advertising and limiting the marketing of fattening food
How to Influence Public Policy • Influencing public policy in order to reduce obesity will require multiple legislative, regulatory, and community-based strategies http://www.coloradohealth.org/uploadedImages/Images/Health_Elevations/Winter_2010/public_policy_graphic.jpg
National coverage of our study • LA Times health blog • Forbes.com • CNNMoney.com • CNN Cafferty File blog • CBSNews.com • The Economist • Edmonton Sun (Canada) • NY Post • USA Today • Atlanta Journal Constitution • News Journal (Wilmington, Del) • Houston Chronicle • SF Chronicle • Hearst Newspapers • National Journal • LA Times • Fort Worth Star Telegram • Orlando Sentinel • Youth Today • Winston Salem Journal • Charlottesville Newsplex • So . CA Public Radio • Kaiser Health News
Public reactions to our study • Fabulous idea! As a Registered Dietitian, I work with people every day that talk about how they "have to" drink soda and eat fast food because it is the only thing that fills them up and they can afford. There is a ton of evidence that shows you can eat healthy foods and spend very little money. A tax on the unhealthy foods would help motivate people to find healthier foods to spend their money on. • This is tyranny. Plain and simple. Who decides what is a “fatty” food?...My friends, we need to say enough is enough! If we don’t stop this we will be living in the United Socialist States of America.
http://www.urban.org/UploadedPDF/411926_reducing_obesity.pdf