
Graphing: Understanding the Relationship between Variables
E N D
Presentation Transcript
Graphing • The relationship between two variables is often determined by graphing • A graph is a “picture” of the data
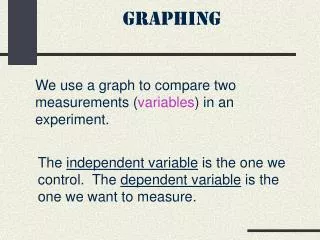
Steps in Graphing 1. identify the independent and dependent variables. independent variable is a set of data points that is varied experimentally dependent variable is the quantity that is measured as a function of the independent variable independent variable is plotted on the x (horizontal) axis dependent variable is plotted on the y (vertical) axis
Steps in Graphing 2. determine the data range. subtract the lowest value of the independent variable from the highest value make a scale for each axis by counting boxes to fit your largest value count by multiples of 1, 2, 5, or 10 to make it easier to plot points fit all data within the limits of the graph (try to use as much of the graph paper as you can)
Steps in Graphing 3. determine the scales. “tick” marks should be equally spaced within the range of the values (scales should be even divisions of the range of the values) size of the scales do not have to be the same for both axes
Steps in Graphing • number and label the axes (including the units!) 5. plot data with cross-mark not x-marks or dots, then enclose each cross-mark with a circle or square. data points should be noticeable and not confused with stray spots or smudges on the paper
Steps in Graphing • draw the best straight or curved line (do not connect the cross-marks) as a good compromise to average random experimental error. data points will rarely fall on a straight line (too high some of the time and too low at other times) straight lines must be drawn with a ruler 7. title the graph (clearly state what the graph represents) y as a function of x.