IceTop
320 likes | 499 Views
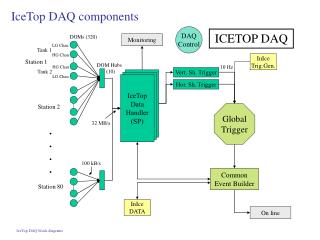
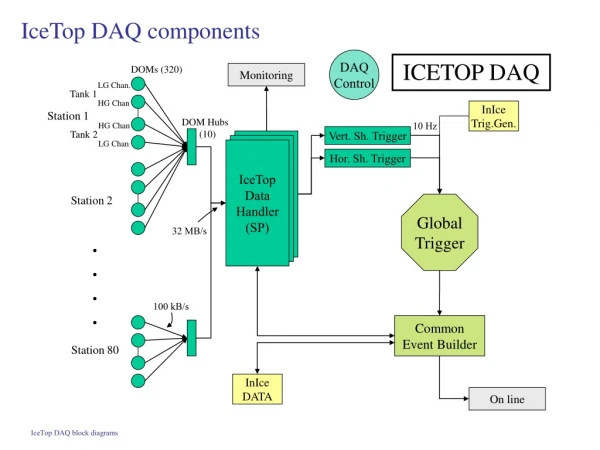
IceTop. IceTop station 2004 test tanks Calibration Verification 04/05 DOM operation Summary (Season plan). IceTop DAQ must capture three classes of events in 04/05:. Single particles (low-energy e ± , m , g for tank calibration) Remnants of low energy interactions

IceTop
E N D
Presentation Transcript
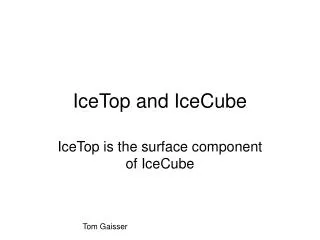
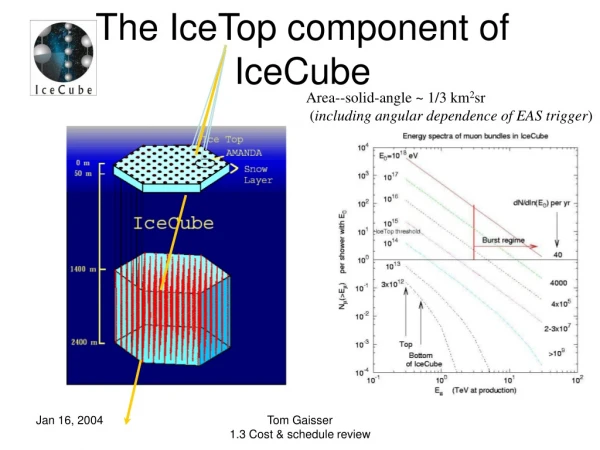
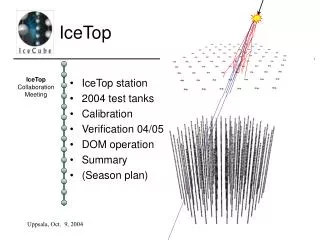
IceTop • IceTop station • 2004 test tanks • Calibration • Verification 04/05 • DOM operation • Summary • (Season plan) Tom Gaisser
IceTop DAQ must capture three classes of events in 04/05: • Single particles (low-energy e±, m, g for tank calibration) • Remnants of low energy interactions • ~ 2.5 kHz for 30 MeV threshold (10 pe) • Muons deposit 200-300 MeV (70 pe) • Small showers (few TeV for tagging single m in deep-ice) • Typical source of m background in deep detector (Em ~ 0.5 TeV initially) • 10-20 m footprint on ground • Coincidence between two tanks at a station • No signal in neighboring stations • No IceTop trigger • Check each in-ice event for such surface activity • Large showers that trigger IceTop (E > 300 TeV for air showers and muon bundles in deep-ice) • 3 or 4 stations hit in ~300 ns window • Primary energy up to 10^7 GeV with 4 stations • [ Horizontal multi-m events (later in year or next season) ] Tom Gaisser
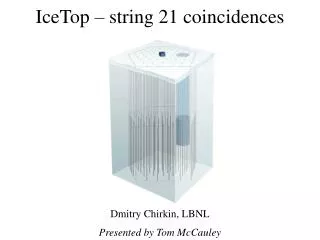
0.9 m Diffusely reflecting liner 2 m IceTop Detector Tom Gaisser
~ 5-10 TeV IceTop station • Two Ice Tanks 2.7 m2 x 0.9 m deep (scaled-down version of Haverah, Auger) • Integrated with IceCube: same hardware, software • Coincidence between tanks = potential air shower • Local coincidence with no hit at neighboring station tags muon in deep detector • Signal in single tank = potential muon • Significant area for horizontal muons • Low Gain/High Gain operation to achieve dynamic range • Two DOMs/tank gives redundancy against failure of any single DOM because only 1 low-gain detector is needed per station Tom Gaisser
Feb 10/11, 2004 Tank 9 with m telescope Tank 10 Tom Gaisser
DOM MainBoard Temperatures http://icecube.bartol.udel.edu/DOMMonitor/DOMTemps.html Tank9 DOMs Tank10 DOMs indicates cold start • Note that • -Tank9 is still 3 deg colder than Tank10 • MB temps 10 degwarmer than ice in normal operation • - Glass temp tracks MB temps, warmer by only 5o • Glass and MB reaches ice temps at cold start • Tankice temps 6 deg warmer than snow • - snow temps 10 deg warmer than air 5 1,2,3,6 -55o 4 5 4 6 3 air 2 1 9 Feb 04 3 Oct 04 9 Apr 04 19 May 04 8 Sep 04 18 Jul 04 Tank10 Temperature Sensors
Tank 2001 (buried under snow—different temperature sensors) Tom Gaisser
Tank calibration & monitoring • Use characteristic spectrum with muon peak and high-energy tail • Requires calibration data stream • Requires lab station for data template (two water tanks at UD) • Requires detailed simulations of response of tanks to • Photons • Electrons • muons Tom Gaisser
Test tanks for calibration:Full station at UD, 1 tank at UWRF Test tank at UWRF with AMANDA OMs Tom Gaisser
John Clem, FLUKA Fig 1
Set discriminator threshold here John Clem, FLUKA Fig 4
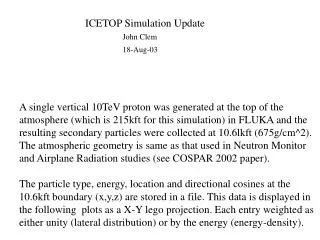
Comparison with measured flux The simulation results are shown as histograms. The dashed green histogram is proton fluxes determined with a higher modulation level primary spectrum. Solid red circle is Bai et al. 2001 measurement. All other data shown is from Grieder 2001. The dashed red line muon measurement at 3250 meters elevation and solid red is 2960 meters. Red diamond 700mbar pressure. Black line is gammas at 750mbars (measurement at unknown geomagnetic cutoff and mod level) . Green line is protons at 3250 meters and green circle at 700g/cm2 (cutoff and mod level unknown) John Clem, FLUKA
Verification 04/05 • Obtain charge spectrum from high-gain DOM in each tank • Obtain rates of station hits and coincidences • station hit = both tanks hit within 100 ns • 1-folds, 2-folds, 3-folds, 4-folds in 500 ns • Zenith and azimuth distributions • Coincidence rates with deep detector Tom Gaisser
Simulated response of single station hits (mostly single muons in deep ice) Low coincidence rate is due to 4-string geometry, dq < 6o in ‘05
Core location distributions, Ep =18 TeV
Core locations for Ep = 2.7 PeV Note that ring of distant singles from PeV showers will be removed by surrounding stations in larger array
Ep, cos(q) distributions of 4-folds 3-fold rate ~ 0.30 Hz
Azimuthal distributions 0o 90o
(VEM*factor) Spectrum of deposited energy for 4-fold events
Numbers in boxes show hit times in ns relative to core time of ideal shower plane -200,-220 -53,-71 13,24 210,220
IceTop DOM settings Set voltages so m peak is centered on ATWD0 of HG DOM and on ATWD2 of LG DOM Require local coincidence between tanks to keep data rate low Short calibration runs to collect single tank particle spectra
Summary • We are on track for 8 tanks in PY3 • Ongoing temperature measurements clarify operating range for IceTop DOMs • Operation of DOMs requires • Local coincidence (or high threshold) • Implementation of DAQ & data handling • Parallel studies with test tanks in labs at UD and UWRF • Simulation studies in parallel for calibration, event reconstruction (Peter Niessen’s talk) Tom Gaisser
Nominal layout of IceTop Minimize deviations from nominal 125 m grid Tom Gaisser
Surface to DOM Cable From Hole Power Converter (green box) Surface Junction Box Freeze Controller 24VDC +/-48VDC IceTop Excavation Temporary Smurf Cables 2 +/-48VDC Cables 1 RS485 Data Cable Surface Cable from Counting House NOTES: 1. Drawing is in approximate relative scale. 2. Tanks are 10 meters between centers. 3. DOM cables are 17 meters long. 4. RS485 Master source is controlled by plugging in the desired data cable. 5. Tank power source is controlled by plugging in desired power cable. 6. Power Converter contains +/-48VDC to 24VDC converter and EMI filter. George Anderson Sept 17, 2004 File Rev F IceTop Station and Surface Junction Box Interface to IceCube System
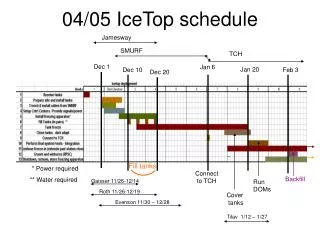
Dec 1 Jan 6 Jan 20 Dec 10 Feb 3 Dec 20 Fill tanks * Power required Connect to TCH Backfill ** Water required Run DOMs Cover tanks 04/05 IceTop schedule Jamesway SMURF TCH Gaisser 11/26-12/14 Roth 11/26-12/16 Evenson 12/4 – 12/27 Tilav 1/12 – 2/1 Lundberg 12/17-1/13 Kelley 12/17-1/18
SMURF = temporary temporary counting house to provide power, & monitoring of freeze control ~ 12/1 to 1/15 when TCH is ready Tom Gaisser
muon charge distribution events m-calibration in Auger 3 PMT avg traces time in 25 ns bins Tom Gaisser
Vertical m (defined by m-telescope) Data with test-tank setup at UD in water. (Large negative amplitudes on left.) In-tank coincidence (defined by 2 OMs) broadened m peak + low energy e-m background Muon self-calibration procedure • Take in-tank coincidence data for each tank for commissioning • Compare to lab template (in water) • Interpret deltas with simulations • Fix parameters for interpretation of signals • Add to data base Tom Gaisser
Auger Compress by ~10 for IceTop Tom Gaisser