Download
1 / 8
80 likes | 188 Views
Study analyzes secondary particles from 10TeV proton at 10.6kft in FLUKA, compared to Neutron Monitor & Airplane Radiation studies. Particle data stored for analysis.

E N D
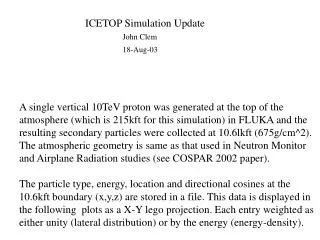
ICETOP Simulation Update John Clem 18-Aug-03 A single vertical 10TeV proton was generated at the top of the atmosphere (which is 215kft for this simulation) in FLUKA and the resulting secondary particles were collected at 10.6lkft (675g/cm^2). The atmospheric geometry is same as that used in Neutron Monitor and Airplane Radiation studies (see COSPAR 2002 paper). The particle type, energy, location and directional cosines at the 10.6kft boundary (x,y,z) are stored in a file. This data is displayed in the following plots as a X-Y lego projection. Each entry weighted as either unity (lateral distribution) or by the energy (energy-density).
Gamma Component in a 10TeV Proton Shower at 10.6kft. Units are in cm and GeV
Electron and Positron Component in a 10TeV Proton Shower at 10.6kft. Units are in cm and GeV
Muon Component in a 10TeV Proton Shower at 10.6kft. Units are in cm and GeV
The shower data file, that was viewed in the previous slides, is used as an input to the GEANT3 tank model. This process will help determine the tank response to such an event. The tank model was moved around to sample the shower. Since axially symmetry is expected from a vertical incident trajectory, samples of equally distances from the vertex point are grouped together as shown in drawing
This displays the total number of PEs for each location as measured by a 10in PMT in a tyvek lined tank with an optical air interface at the surface.
Average PE Production Time (tanks at 10.6kft) measured from the top of the atmosphere arrival of a 10TeV Vertical Proton ( for this case TOA=215kft). It is assumed the conversion time of a photon to a PE is negligible therefore photon arrival times and PE production times are identical. For viewing purposes, the times were offset by 0.236msec
The spread (rms) of the PE production times for each location with 3 or more PEs..