Download
1 / 31
310 likes | 441 Views
Jarmo Koistinen FMI, Finland IPWG/GPM/GRP Workshop on Snowfall, Madison, October 2005. Northern European Possibilities for Ground Validation of Snowfall. Most of Finland belongs to boreal forest climate: 100-220 snow cover days/year Average snow depth in March 20-90 cm.

E N D
Jarmo Koistinen FMI, Finland IPWG/GPM/GRP Workshop on Snowfall, Madison, October 2005 Northern European Possibilities for Ground Validation of Snowfall
Most of Finland belongs to boreal forest climate: • 100-220 snow cover days/year • Average snow depth in March 20-90 cm
FMI weather radar network 8 C-band Dopplers Polar V, dBZ (dBT, W) archived since 2000 Data availability 99.3 % incl. maintenance and telecommunications in 2004
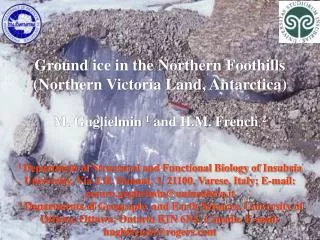
Potential GV site for snow Sodankylä (the northernmost radar, 67°N) Global CEOP* validation site (Nr 29) *Coordinated Enhanced Observing Period (CEOP)
Helsinki Testbed (HTB), 60°N, 2005-2007-?A coastal, mesoscale high latitude research and development facility (WMO/WWRP endorsement tbd). All other stations shown except Road Weather. Average WS distance 9 km (FMI regular 50 km). • IC lightning system + CG lightning system
HTB Precipitation Measurements -circles: radar 20-60km (0-250 km) -dot: manual obs -big diamond: FD12P -small diamond: potential FD12P -triangle: autom snow depth -square: weighing gauge - plan: 2 POSS to be implemented http://testbed.fmi.fi public realtime data during the campaigns (6 months during Aug 2005 – Aug 2006, snow: Nov, Jan-Feb)
Vaisala polarimetric radar at HTB, prototype resultsRHI scans across a bright banddBZ ρHV LDR
BALTRAD composite 2005-05-28 14:15 UTC WCRP/GEWEX/BALTEX: DBZC - Composites of radar reflectivity • More than 30 radars in 11 countries: BALTRAD • Radar Data Centre at SMHI, Sweden (Daniel Michelson) • Continuous operation since October 1, 1999 • Resolutions: 22 km, 15 minutes, 0.4 dBZ BALTEX Radar Data Center
RR - 3 and 12-hour Gauge-adjusted Accumulated Precipitation +Gauges-only Accumulation • 22 km horizontal resolution • Every 3 and 12 hours • 32-bit depth • Wind corrected gauge observations • 3-hour BALTRAD area • 12-hour BALTEX Region (see example)
Eumetnet OPERA Programme:“The aim of OPERA is to harmonize European radar data and products, raise their qualities, facilitate their exchange, and support their application” • Opera runs projects on • Quality information • Radar data use • New technologies • Products to exchange • New data formats • BUFR software • Radar data hub
European Co-operation in the Field of Scientific and Technical Research (COST)
Development work for improved precipitation data quality Development work for improved soil moisture data quality Development work for improved snow data quality Development work for improved data assimilation schemes Routine production of precipitation data for systematic value assessment Routine production of soil moisture data for systematic value assessment Routine production of snow data for systematic value assessment Space-time continuisation for gridded data at specified times by assimilation Measured precipitation Computed precipitation Computed soil moisture Computed snow parameters Measured soil moisture Measured snow parameters Assessment programme to evaluate the benefit of satellite-derived precipitation, soil moisture and snow information in European hydrology and water resource management Fig. 01 – Logic of the H-SAF Development phase. EUMETSAT: Hydrology SAF • SAF = Satellite Application Facility under EUMETSAT contract • HSAF lead by Servizio Meteorologico dell’Aeronautica, Italy • Hydrology SAF • Precipitation (Italy) • Soil Moisture (Austria) • Snow parameters (Finland) • Mainly EUMETSAT operational satellites, but also other (research) satellites are used, when applicable
Hydrology SAF Satellites/instruments during development: NOAA (AVHRR) + MetOp (AVHRR, ASCAT) + Meteosat (SEVIRI) + EOS-Terra/Aqua (MODIS) + DMSP (SSM/I, SSMIS) + EOS-Aqua (AMSR-E) + QuickSCAT (SeaWinds) Products • Snow recognition (SR) • Snow effective coverage (SCA) • Snow status (wet or dry) • Snow Water Equivalent(SWE) Satellites/instruments during operations: MetOp (AVHRR, ASCAT) + Meteosat (SEVIRI) + NPOESS (VIIRS, CMIS) + MW radiometers of the GPM constellation
Calibrations GPM estimates GV main tasks Radar estimates SFWE(Ze) Major sources of error are hiding here In situ estimates (SFWE) gauges, POSS etc Rarely available Real snowfall at ground including density Wind correction Growth of uncertainties in the Ground Reference process of snowfall at ground WMO inter- comparison
Work to improve quality(implemented) Absolute calibration is still an issue (at best 1-3 dB): • A relative calibration method based on comparing precipitation accumulation in the overlapping area of radar pairs. • Elevation angle calibration to better than 0.05 degrees (high latitude sun hits the operational scans densely during rise and set). Cold climate phenomena diagnosed applying pattern recognition and fuzzy logics (in future applying polarimetry): • Anomalous propagation common introducing strong sea and ship clutter. • Migration of birds and insects.
Better accuracy with integrated data: • Hydrometeor phase analysis (rain, sleet, snow) based on Kriging-analysis of SYNOP data (T,RH). Resolution 5 min & 1 km (extrapolation). • Time-space variable Z – R / Ze – S relations.Operational since 1999: Grey background: snowBlue background: rainPink background: mixed
But R(Z)-S(Ze) relations play only a minor role 3000 gauge/radar winter comparisons • Variable-phase (R or S) method in solid line • Z-R only in dashed line • Snow cases in orange, all cases in grey • Correct Z-R or Z-S is negligible compared to the increasing bias as a function of range due to the vertical profile of reflectivity! Gauge/Radar Range
Examples of measured reflectivity profiles Snow,melting close to ground Snow
Overhanging snow (virga, Altostratus) Snow, evaporation and residual clutter 1(2)
1(2) Automatic real time classification of VPRs based on radar and NWP data (556 471 profiles) VPR. type (at ground):
Snowfall measurements require 20 dBs more sensitivity than those of rainfall Cumulative probability distribution of snowfall in 106 825 profiles (range 2-40 km) MDS of GPM
Climatological profiles based on the measured 220 000 precipitation profiles
Vertical profiles of reflectivity (VPR) in winter introduce large biases (S) in the radar estimates of surface precipitation 1(2)
Profile correction for 500 m PsCAPPI Example: A Snow Case 1(2)
Yearly average ground reference bias for 500 m PsCAPPI as a function of range In snowfall sample size 106 000 VPRs 1(2)
Improving reference data applying a spatially continuous VPR correction Corrected to ground level Measured 24 h accumulated precipitation Nov 7, 2002, 14 UTC 1(2)
Remaining problem: complete beam overshooting in very shallow snowfall.
GPM Blind Zone may mask shallow precipitation Case: Precipitation top height March 2001 (snow). Note: 0.3-1 km high snowfall regular in Finland (difficult to diagnose from VPRs). Not known 1(2)
Better accuracy with integrated data – but in proper order! • Remove non-meteorological echoes and OP. • Attenuation correction (sleet!). • Blocking- & VPR-correction & intelligent compositing => Precipitation at ground • Time-space variable R(Z) / S(Ze) relations. • Diagnose areas of total beam overshooting and POD of snowfall detection. • Gauge-radar adjustment.