Download
1 / 36
360 likes | 486 Views
Use of Profilers in TRMM Ground Validation. Kenneth Gage 1 , and Christopher Williams 1,2 1 NOAA Aeronomy Laboratory, Tropical Dynamics and Climate Group 2 University of Colorado, Cooperative Institute for Research in Environmental Sciences (CIRES). Outline. Introduction

E N D
Use of Profilers in TRMM Ground Validation Kenneth Gage1, and Christopher Williams1,2 1NOAA Aeronomy Laboratory, Tropical Dynamics and Climate Group 2University of Colorado, Cooperative Institute for Research in Environmental Sciences (CIRES)
Outline • Introduction • Profiler as a Reflectivity Standard • Profiler determination of vertical reflectivity gradient structure in stratiform and convective precipitation • Profiler retrieval of DSD and precipitation parameters as an alternative to Z-R.
NASA-TRMM Ground Validation Program The Aeronomy Lab was involved with these field campaigns: Texas (April 1998) TEFLUN-A Florida (July-Sept 1998) TEFLUN-B Brazil (Jan-Feb 1999) TRMM-LBA Kwajalein (July 1999-Present) KWAJEX Darwin (1997-Present)
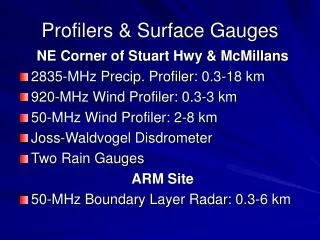
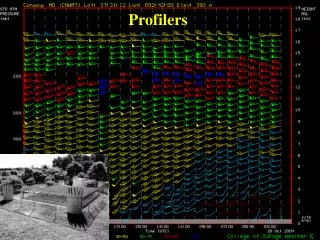
TEFLUN-B, Triple-N-Ranch, Florida July – September 1998 915 MHz Profiler 2835 MHz Profiler Joss Waldvogel Disdrometer 2-Dimensional Video Disdrometer
Reflectivity (amplitude) Doppler Velocity (air motion + particle motion) Spectral Width (turbulence and particle size variation) == 2*sqrt(var)
How Can Profilers Help with Ground Validation? Profilers in combination with disdrometers rain gages and polarimetric scanning radar can be used to improve the quality of QPE on the ground. Profilers in combination with other instruments can be used to provide physical validation to evaluate and improve algorithm performance. Profilers can provide information on the variability of Precipitation parameters on a scale which lies within the pixel size of scanning radars and satellite footprints (relevant to non-uniform beam filling and background error covariance for assimilation into models).
Profilers Provide a Reflectivity Standard for other Ground-Based Instruments
Reflectivity Time Series in Stratiform Rain from Collocated Profilers during TRMM LBA
Precision Statistics of Two Collocated Profilers in Central Florida in 1998 During TEFLUN B Plotted are: Pdf of reflectivity difference Bias and 95% confidence as a function of profiler reflectivity Pdf of profiler reflectivity
Profiler and WSR- 88D Reflectivity Comparison during TEFLUN B Top Panel: 915 MHz reflectivity 21 August, 1998 Second Panel: 915 MHz reflectivity degraded to 630 m & 5 minute resolution. Third Panel: WSR-88D reflectivity over the profiler. Bottom Panel: Profiler reflectivity variability at WSR-88D Resolution
Reflectivity Difference for all Rain Events (August-September 1998) Mean +/- 95% C.I. in 2 dBZ intervals PDF(ΔZ) PDF(ZProfiler) 2,062 Obs
Vertical Structure of Reflectivity at Legan in stratiform and convective precipitation
Reflectivity Dependence of Vertical Structure of Reflectivity at TEFLUN B and LBA
Calibration of TRMM-LBA profiler, Ji-Pirana, Brazil; January - February 1999 Top Panel: Scatter Plot of 2835 MHz profiler reflectivities at 202 m compared to calculated JWD disdrometer reflectivities excluding JWD samples with less than 64 drops. Bottom Panel: Reflectivity differences between profiler and disdrometer as a function of disdrometer reflectivity.
DSD Model Descriptions The DSD retrieval models assume different functional forms of the DSD and are divided into two numerical classes. Deconvolution Techniques Note-For methods A,B, and C, the cost function was minimized in Dk space with k = 3, 4, 5, and 6 to produce 4 different solutions. Convolution Techniques
Dm & R Statistics at 3.2 km The top panel shows the 920-MHz profiler reflectivity for the precipitation event that passed over the Darwin, Australia, profiler site on 16 February 2003. Panel (b) shows the reflectivity at 3.2 km. The mean and standard deviation of the ensemble Dm and R are shown for the 3.2 km altitude in panels (c) and (d).
Statistics Relative to the Ensemble Mean The mean mass-weighted diameter, Dm, is estimated for each DSD model and the ensemble mean is estimated for each resolution volume (each time-height sample). The statistics relative to the ensemble mean are shown here.
Summary of Profiler Contributions to Ground-Based QPE • Reference reflectivity in the column over the profiler • Vertical structure of the precipitation parameters above the surface • Direct estimates of precipitation parameters based on profiler retrieved drop-size distributions
GPM Front-Range Reflectivity Comparison: 16-17 June 2004
Calibrating Vertically Pointing Profilersusing a Surface disdrometer Joss-Waldvogel Disdrometer manufactured by Distromet. Detects and calculates the ‘momentum’ of individual rain drops hitting the head. Converts the momentum of each drop to a raindrop size. Yields the number and size of raindrops hitting the 50 cm2 head. Aeronomy Lab developed software to record the full diameter resolution (127 bins), [Manufacture’s software provides 20 bin output].
400 MHz Doppler Spectrum Source: Greg Forbes
Ground Validation for TRMM and GPM • TRMM Ground Validation utilized rain maps produced by scanning radar at various locations around the globe. However it was found that the uncertainty in the ground validation rain products was large and the ability to validate satellite algorithms was limited. • GPM ground validation will place more emphasis on the physical validation of algorithms in continental and oceanic ‘supersites’. Observations will be made in a multidimensional observing volume to support the use of a Satellite Simulator Model.
Reflectivity Time Series from Collocated Disdrometers at Wallops Is. Source: Ali Tokay
Use of Profilers in Ground Validation for TRMM The introduction of profilers in TRMM ground validation efforts was accomplished as a research effort and was not part of the originally planned Ground Validation activities for TRMM.
Factors Contributing to Poor QPE • Calibration of scanning radar • Reflectivity gradients in the lower atmosphere • Use of unrepresentative Z-R relations
Use of Disdrometers and Profilers to Calibrate Scanning Radars Disdrometer
Profiler Reflectivities vs. Disdrometer Reflectivities from TRMM LBA
Approach to Ground Validation TRMM GV emphasized the statistical validation with surface rainfall maps at a number of locations but these products were not of sufficient accuracy to be very useful and largely ignored the physical validation that would be needed to validate algorithm assumptions and performance.
Summary of TRMM EXPERIENCE Based on the experience of their use in TRMM ground validation field campaigns, profilers are becoming well established tools for use in multi-sensor field campaigns. A data archive of reflectivity, Doppler velocity, and spectral width was produced for each field campaign. A calibration procedure was developed utilizing co-located disdrometers and substantial progress was made toward routine retrieval of drop-size distributions from profiler measurements.
Drop Size Distributions from Profiler Observations Key is to separate air motions from hydrometeor fall velocities. • Two profilers operating at different frequencies to distinguish Bragg and Rayleigh scatter • Single profiler with Bragg and Rayleigh components of the Doppler spectrum present • Single UHF profiler without Bragg component: Sans Air Motion (SAM)
The DSD is the building block used to determine precipitation parameters Examples of Precipitation Parameters: Reflectivity = ∫ N(D) D6 dD Liquid Water Content ~ ∫ N(D) D3 dD Rain Rate ~ ∫v(D) N(D) D3 dD Mean Mass-weighted Diameter, Dm Dm = ∫ N(D) D4 dD /∫ N(D) D3 dD Dm = (4 + µ) / D6 Dependence – Radars are sensitive to this dimension D3 Dependence Dependent only on the shape of the DSD. Independent of No