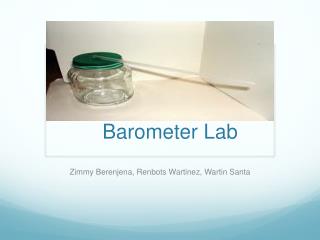
Barometer Lab
Barometer Lab. Jaime Andres Paredes 8C. Problem. How can a home-made barometer measure air pressure in order to predict a week of weather? Steps: Building a Barometer Testing it over 7 days (twice a day) Predicting weather for the day based on air pressure levels. Background.

Barometer Lab
E N D
Presentation Transcript
Barometer Lab Jaime Andres Paredes 8C
Problem • How can a home-made barometer measure air pressure in order to predict a week of weather? • Steps: • Building a Barometer • Testing it over 7 days (twice a day) • Predicting weather for the day based on air pressure levels
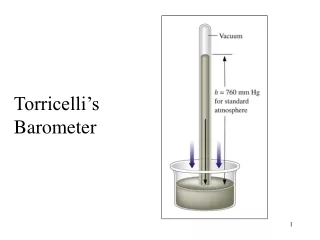
Background Air Pressure • Altitude is greater at point A • Air pressure is greater at point B • Density of the air is greater at point B • A cubic meter of air has less mass at point • The percentage of oxygen at point A is 45-65% of air • Altitude • Air Pressure • Density • Because molecules in air push in all directions • Inches of mercury and millibars • Air pressure- C • Altitude- F • Aneroid Barometer- G • Barometer- D • Density- A • Mercury Barometer- E • Pressure- B
Variables • Independent: Time • Dependent: Air Pressure • Weather changes depending on air pressure • Controls: • Barometer (location, size, environment)
Hypothesis • If air pressure rises, then there will be clouds and possibly a storm, because high air pressure marks the formation of a storm • If air pressure lowers, then the clouds will clear away, because los pressure indicates a no-cloud day
Data Analysis Time
Data Analysis 2) In Quito, air pressure varies and rises, drops and stays the same. You could say the weather is crazy, because some days, it rains, is cloudy, then sunny, and then it hails, so weather is unpredictable here. The different pressures confuse me, because of the weather changes so abruptly 3) I collected 14 weather points. It’s not enough, since 7 days have abrupt changes between sunny and cloudy days, maybe a month would do just fine 4) Actual weather proves right or wrong the prediction of weather, and the relationship between air pressure and weather 5) No. my data isn't reliable, most of the days had 12-13 of air pressure, and the weather varies too much (sunny, then cloudy, then rainy, and clear again) 6) Yes. The pointer was easy to read and the balloon is well sealed. Although, you have to consider its home made
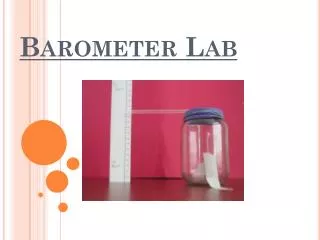
Data Analysis 7) • Rising:Air pressure must increase, pushing the balloon downwards and compressing the air in the jar. This rises the free end of the straw. • Falling: Air pressure must decrease. Then the air in the jar will expand and “inflate” the balloon, lowering the free end of the straw. • 8) • High air pressure: Usually related to sunny days, clear days, “good weather” days • Low air pressure: Usually related to cloudy and rainy days, “bad weather” days 9) If the balloon had a hole, air could get in and out. This would damage the barometer because low and high pressures are what contract or expand the air in the jar. If there is no contraction or expanding, the straw would not rise or lower. 10) Temperature changes in the environment would also make the air inside the jar to contract with cold or expand with heat, giving fake results based on temperature, not on air pressure
Conclusion The barometer experiment gave a lot of data to process and analyze. My hypothesis was incorrect. I said that low pressure meant good weather, and high pressure meant storms. I found out with the barometer that, low pressures (12-12.5 cm), indicated rain and clouds; and high pressures (13+ cm) indicated clear and sunny days. The lab had errors that could be fixed. First, the barometer was exposed to the environment temperature, so air could expand or contract, giving off fake air pressure measurements. The lab could say that the barometer should be placed in shadow, so that the sun doesn’t hit and affect the results. Also, the measuring time could be extended, so that the data collection takes longer, and the results become more accurate. In addition, the lab could say a specific size of barometer, and an actual measuring unit (basically changing cm for millibars). All these errors could make the data more clear, accurate and professional.
Bibliography • Admin. Homemade Barometer. Digital image. Science Fair Projects Hub. Web. 18 May 2012. <http://www.sciencefairprojectshub.com/homemade-barometer/2010/>. • Altitude Sickness Explained. Digital image. Altitude Sickness. 13 Jan. 2012. Web. 18 May 2012. <http://altitudesick.com/index.php/category/oxygen-vail/>. • VanCleave, Janice. Measure the Effectiveness of Homemade Barometers in Predicting Weather. Digital image. Education.com. Web. 18 May 2012. <http://www.education.com/science-fair/article/effective-homemade-barometers-predicting-weather/>.