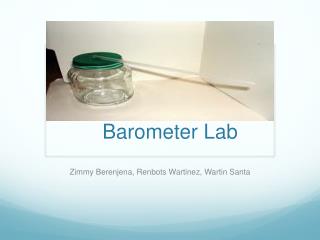
Science Barometer Lab
Science Barometer Lab. By Sebastian Pérez-Isabela Barreiro-Paola Vela-Daniel Ianotti. Background info, Problem. Problem: How does the air pressure change throughout the week? Background: 1 . P oint A 6. M ass, density, pressure 11. G


Science Barometer Lab
E N D
Presentation Transcript
Science Barometer Lab By Sebastian Pérez-Isabela Barreiro-Paola Vela-Daniel Ianotti
Background info, Problem • Problem: How does the air pressure change throughout the week? • Background: 1. Point A 6. Mass, density, pressure 11. G 2. Point B 7. Moleculespush to all directions 12. D 3. Point B 8.Millibars and inches of mercury 13. A 4. Point A 9. C 14. E 5. 20.5% 10. F 15. B
Variables and Hypothesis • Variables: • The time of day is the independent variable and the pressure is the dependent variable. In other words, the pressure changes depending on the air density and temperature of the air. One controlled variable is height (altitude). • Hypothesis: • If we use a barometer to detect air pressure then we would know how the weather is going to be because this is a scientific tool that is made for measuring air pressure and also detects how is going to be the weather.
Questions from graph • 2. From the graph, what can you conclude about changes in air pressure? In what we can conclude my group and me is that during a week of recording the air pressure the pressure in Quito changes a lot even during the same day. • 3. How many data were you able to collect? Do you think this enough data to make conclusion about air pressure and weather changes? We were able to collect 14 data points (two each day). And we think that it is enough to know that Quito pressure is very variety in winter time, also we could see the limits of the air pressure during winter (13-14), and weather is that it can be very unpredictable because of so many changes on the air pressure. • 4. Why was it important to record observations about the weather conditions? Because this way we can know how weather affects air pressure • 5. Was your data reliable? Explain why or why not. The data was reliable since e recorded our information every day twice, we were really careful to record every single data carefully and meticulously
Questionsfromgraph • 6. Was your data accurate? Explain why or why not. The data was accurate since we took the measurements precisely and the results demonstrated the data collected. • 7. What change in atmospheric conditions must occur to cause the free end of the straw to rise? What change must occur for it to fall? The straw rises when the pressure rises. The straw falls when the pressure deceases • 8. According to your observations, what kind of weather is usually associated with high air pressure? With low air pressure?When the pressure is high the weather is hot. When the pressure is low it can either be cold or rain • 9. If your balloon had a tiny hole in it, what would happen to the accuracy of your barometer? The barometers won’t have accurate results since the air will go out and we cannot detect pressure change anymore • 10. What effect, if any, would a great temperature change have on the accuracy of your barometer? Explain. For example, an effect would be a drastic change of weather. When it is raining really heavy and suddenly the sun comes out. The barometer will lose accuracy due to it drastic change
Coclusion By providing evidence from your results, write a concluding paragraph that explains:a) Whether or not your hypothesis was supported by your results;b) An interpretation of your results; andc) Name at least two sources of error that might have affected your results. How could the lab be re-designed in order to reduce this error? • Our hypothesis was supported by the results we got since every day we could tell the weather by the change and behavior of the pressure. Our results supported our prediction totally. Each day, the changes of the measurements were not so great. We took 2 measurements each day. The days were the pressure was the highest was in March 19, the pressured reached to 14 centimeters. The days were the pressure was the lowest was in March 16 and 17, the pressure reached to 13.3 centimeters. The pressured increased or decreased about 2 digits each day and it will also stay the same some days. What could have affected our results could have been the locations were the data was taken because some places are higher than others, therefore the pressure will change. As well as the position of the straw. If the straw was glued too tight then it wouldn’t move so much. But if the straw wasn’t too tight then it will move very much instead. With this error we could not know whether our measurements are right or wrong.