Download

1 / 29
290 likes | 530 Views
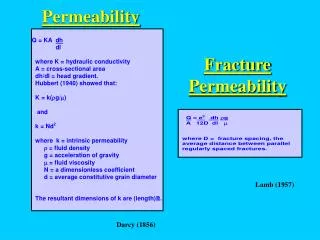
Prediction of Corneal Permeability. David Kim Allergan Inc. SoCalBSI California State University, Los Angeles. Objective. Develop a model to predict corneal permeability based on literature compounds. Introduction. Ocular drug delivery mechanism (through cornea and/or conjunctiva)

E N D
Prediction of Corneal Permeability David Kim Allergan Inc. SoCalBSI California State University, Los Angeles
Objective • Develop a model to predict corneal permeability based on literature compounds
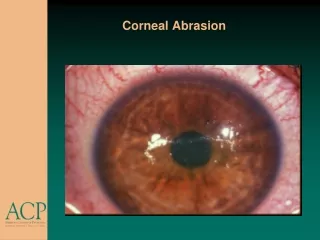
Introduction • Ocular drug delivery mechanism (through cornea and/or conjunctiva) • Focus of the project is the corneal route
Why predict corneal permeability? • Allergan, Inc. develops drugs which are administered through the eye • A drug is only effective if it can reach its target tissue • Can save company time and money in determining if the drug can pass through the cornea before the drug is synthesized
Introduction • Few models have been developed to predict corneal permeability • Congeneric model (one class of compounds) • Non-congeneric model (mutiple class of compounds) • Develop non-congeneric model focused on drug-like compounds
Literature • Compound names • logPC and logD • structure of compounds Generate descriptor values Filter descriptors (intuitively) Find optimal training and testing set percentage Run Partial Least Squares modeling Statistical analysis Pick best model Final Model Remove descriptor with the lowest importance Rebuild model
Log PC = log of the Permeability Coefficient (cm/s) Partition Coefficient: Log D = log of the Distribution Coefficient (pH 7.65) Yoshida, F., Topliss, J.G., J. Pharm. Sci. 85, 819-823 (1996)
Yoshida, F., Topliss, J.G., J. Pharm. Sci. 85, 819-823 (1996)
Compounds in Literature • Went through published literature • Filtered compounds to look only for drug like compounds • Came up with 30 compounds and their measured permeability • Next step in our model building process is to produce descriptors for each of our compounds
Descriptors • Molecular weight or volume • Degree of ionization • Aqueous solubility • Hydrogen-bonding • Log D • Polar surface area (PSA) • pKa • Solvent accessible surface area
Schrödinger Software • Named after Erwin Schrödinger –Nobel prize winner for the Schrödinger equation which deals with quantum mechanics • Suite of various programs dealing with computational chemistry • Two programs used: • Maestro – calculate descriptor values • Canvas – generate model
Maestro Program • Can generate 77 descriptors • Can manually input descriptors (eg. log D) • Filtered descriptors which do not deal with permeability (intuitively) to reduce noise • Came up with 30 descriptors to use • Export the 30 compounds and its 30 descriptors to Canvas
Canvas Program • Partial Least Squares (PLS) modeling • Can specify what descriptors to use to build the model • Can specify the compounds used for training and testing the model • Model assessment: corresponding statistics of the model
Statistics • Training Set • Standard deviation (SD) – low • Coefficient of determination (R2) – high close to 1 • Coefficient of determination, cross validation (R2-CV) – high close to 1 • Stability – close to 1 • F-statistic (overall significance of the model) – high • P-value (probability that correlation happened by chance) – low <0.01
Statistics • Testing Set • Root Mean Squared Error (RMSE) – low • Q2 – high close to 1 • Pearson correlation coefficient (r-Pearson) – high close to 1 • Important for the assessment of what percentage of the compounds we want to use for the training set • Important for the assessment of our model as we start to remove unnecessary descriptors
Finding the ideal training set percentage • Ran PLS modeling specifying various percentages to use for the training set • 40%, 50%, 60%, 70%, 80% • Looked at the statistics of each of the models built • Found that using 80% of the compounds for the training set was ideal • 30 compounds found in literature • 24 in training set and 6 in the testing set
bx coefficient • After the PLS model is built, it gives the bx coefficient for each descriptor in order to predict permeability • The bx coefficient is the weight that the model puts on the descriptor after the descriptor values have been scaled Example: log PC = 0.348(scaled MW) –0.221(scaled log D) -0.002(scaled log P)……
Removal of descriptors • Started with 30 descriptors and built a model • Identified the descriptor with the lowest bx coefficient and removed it • Rebuilt model with 29 descriptors • Repeat…. while keeping track of the statistics • Want to keep track of statistics to know when to stop Example: log PC = 0.348(scaled MW) –0.221(scaled log D) -0.002(scaled log P)………….(30) log PC = 0.392(scaled MW) –0.183(scaled log D)……………………………….………….(29)
Training Statistics Test Statistics
Remaining 8 Descriptors • CIQPlogS – conformation independent predicted aqueous solubility • QPlogS - predicted aqueous solubility • FOSA – hydrophobic component of the total solvent accessible surface area • PISA - (carbon and attached hydrogen) component of the total solvent accessible surface area
Remaining 8 Descriptors • QPlogKp - predicted skin permeability • QPlogBB – predicted blood/brain partition coefficient • donorHB - Estimated number of hydrogen bonds that would be donated by the solute to water molecules in an aqueous solution • log D – Distribution coefficient
Permeability Model Function log PC = -0.1371(scaledCIQPlogS ) - 0.1383(scaledFOSA) + 0.1792(scaledPISA) + 0.1558(scaledQPlogBB) + 0.2815(scaledQPlogKp) - 0.1451(scaledQPlogS) - 0.2242(scaleddonorHB) + 0.2646(scaledlogD) SD = 0.460791 R2 = 0.814213 F = 46.0162 (p < 0.0000001)
Conclusion • Successfully created a model to predict the corneal permeability of compounds • Showed that the Schrödinger software generates significant descriptors to build a permeability model
Potential Future Work • Apply the model to external training set to asses its predictability power • Build a more refined model with more compounds • Find other descriptors other than the ones generated by Maestro and use them in the model building
Acknowledgments • Dr. Ping Du • Dr. Chungping Yu • Pushpa Chandrasekar • Noeris Salem • Allergan • SoCalBSI