Download
1 / 16
370 likes | 723 Views
Digital Image Processing:A Remote Sensing Perspective FW5560 Lecture 13 Vegetation Transformations. Vegetation Spectral Characteristics and Their Impact on Transformations and Indices. Vegetation reflectance is influence by the structure of the leaf and its pigmentation

E N D
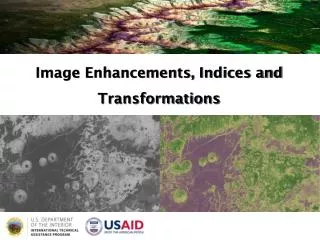
Digital Image Processing:A Remote Sensing Perspective FW5560 Lecture 13 Vegetation Transformations Vegetation Spectral Characteristics and Their Impact on Transformations and Indices
Vegetation reflectance is influence by the structure of the leaf and its pigmentation Different leaf pigments affect spectral signature Chlorophyll dominant- green Carotenoids (yellow/orange pigment)- 0.40 - 0.75 m. Two types- xanthophylls and carotenes- absorb blue light. Protect the cholorphyll from photodamage.
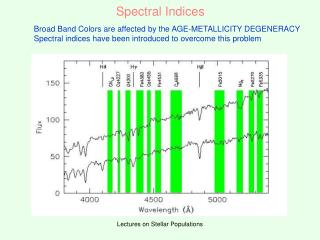
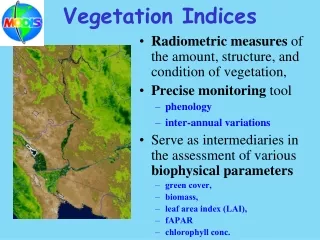
Vegetation Indices- widely used transformation for 2 reasons: Certain aspects of the shape of spectral reflectance curves of different earth surface cover types can be enhanced by ratioing. Undesirable effects on the recorded DNs such as variable illumination caused by variations in topography can be reduced. From: Campbell- Introduction to Remote Sensing
Healthy vegetation reflects strongly in the near-infrared portion of the spectrum while absorbing strongly in the visible red. Soil and water, show near equal reflectances in both the near-infrared and red portions. Thus, a ratio image of Landsat ETM+ Band 4 (Near-Infrared - 0.8 to 1.1 mm) divided by Band 3 (Red - 0.6 to 0.7 mm) would result in ratios much greater than 1.0 for vegetation, and ratios around 1.0 for soil and water. The discrimination of vegetation from other surface cover types is significantly enhanced. Better able to identify areas of unhealthy or stressed vegetation, which show low near-infrared reflectance, as the ratios would be lower than for healthy green vegetation.
Reflectance Response of a Single Magnolia Leaf (Magnolia grandiflora) to Decreased Relative Water Content
Infrared/Red Ratio Vegetation Index The near-infrared (NIR) to red simple ratio (SR) is the first true vegetation index: It takes advantage of the inverse relationship between chlorophyll absorption of red radiant energy and increased reflectance of near-infrared energy for healthy plant canopies (Cohen, 1991) .
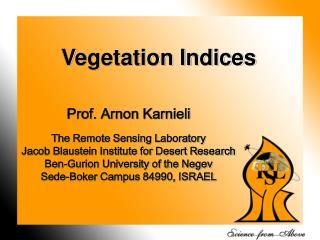
Normalized Difference Vegetation Index The generic normalized difference vegetation index (NDVI): has provided a method of estimating net primary production over varying biome types (e.g. Lenney et al., 1996), identifying ecoregions (Ramsey et al., 1995), monitoring phenological patterns of the earth’s vegetative surface, and of assessing the length of the growing season and dry-down periods (Huete and Liu, 1994).
Using and Ecoregion Framework to Analyze Land Cover and Land Use Dynamics, Gallant et al, 2004, Environmental Management
Perpendicular Vegetation Index Soil Line PVI = 0 Water PVI < 0 Vegetation PVI > 0 PVI measures the orthogonal distance from the pixel in question to the soil line.
Evaluation Of Landsat-5 Thematic Mapper Data For Detecting Potential Construction Areas For Intensified Housing, Thomas J. Blaser, Ronald J.P. Lyon and Kai Lanz 1990, Geoscience and Remote Sensing Symposium, 1990. IGARSS '90. 'Remote Sensing Science for the Nineties, 10th Annual International
Phenological Cycles of San Joaquin and Imperial Valley, California Crops and Landsat Multispectral Scanner Images of One Field During A Growing Season
Distribution of Pixels in a Scene in Red and Near-infrared Multispectral Feature Space