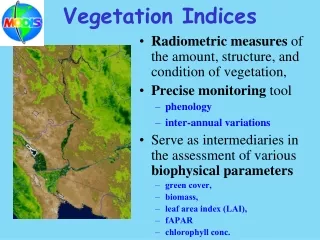
Vegetation Indices
Vegetation Indices. Prof. Arnon Karnieli The Remote Sensing Laboratory Jacob Blaustein Institute for Desert Research Ben-Gurion University of the Negev Sede-Boker Campus 84990, ISRAEL. Definition. Simple Ratio (SR). SR = NIR / Red. Vegetation health. Characteristics of SR.

Vegetation Indices
E N D
Presentation Transcript
Vegetation Indices Prof. Arnon Karnieli The Remote Sensing Laboratory Jacob Blaustein Institute for Desert Research Ben-Gurion University of the Negev Sede-Boker Campus 84990, ISRAEL
Simple Ratio (SR) SR = NIR/Red
Characteristics of SR • The SR is based on the difference between the maximum absorption of radiation in the red (due to the chlorophyll pigments) and the maximum reflection of radiation in the NIR (due to the leaf cellular structure), and the fact that soil spectra, lacking these mechanisms, typically do not show such a dramatic spectral difference. • The values of the SR range from 0 to infinity • SR uses radiance, surface reflectance (), or apparent reflectance (measured at the top of the atmosphere) rather than digital numbers.
NIR-Red scatterplot SR = NIR/Red NIR
The Normilized Difference Vegetation Index NDVI = (NIR- Red)/(NIR+ Red)
SR vs. NDVI • NDVI has the advantage of varying between -1 and +1, while the SR ranges from 0 to infinity. • In NDVI it is easier to separate snow, clouds, and water (negative values) from soil and vegetation (positive values).
Interpretation of NDVI High index values dense/health vegetation Low index values sparse/stress vegetation Typical NDVI values: Bare soils: 0.08 – 0.1 Desert vegetation: 0.1 – 0.3 Tropical forest: 0.4 – 0.6 Water, snow, clouds: <0
Applications of NDVI • High Correlation with: • Photosynthetic activity • Vegetation cover • Leaf area index • Green leaf biomass • Carbon fluxes • Foliar loss and damage • Chlorophyll content • Also used for: • Crop classification • Plant Phenology • Change detection
Leaf Area Index (LAI) Leaf Area Index is defined as the total one- side green leaf area per unit ground surface area (m2/ m2). LAI example LAI = 6 means 6m2 leaf area per 1m2 ground area.
Leaf Area Index (LAI) • It is an important biological parameter because: • It defines the area that interacts with solar radiation and provides the remote sensing signal • It is the surface that is responsible for carbon absorption and exchange with the atmosphere.. Methods Direct: Indirect: Destructive sampling Radiation measurements Remote sensing
NDVI product Red Near Infrared NDVI
NDVI - Israel NDVI derived from NOAA-AVHRR
NDVI of snow True Color NDVI
NDVI Phenology Low NDVI VALUE High
Maximum Value Composite (MVC) 2,400 km
Maximum Value Composite (MVC) Pixel 1 Pixel 2 Pixel 3 Pixel 4 Time
MVC - importance Backward view angle Forward view angle Nadir 2330 km SWATH • Eliminate effects of cloud cover • Eliminate effects of atmospheric aerosols • Eliminate effects of view zenith angle • Eliminate effects of solar zenith angle
Maximum Value Composite (MVC) residual clouds
NDVI time series Movie
NDVI global coverage Movie
Perpendicular Vegetation Index (PVI) The objective of PVI is to remove the effect of soil brightness and isolate reflectance changes due to vegetation only C E A Greening Line NIR Reflectance D Soil Background Line A, B = Pixels of bare soil C, D = Pixels of partly green vegetation cover. E = Pixel of green vegetation B Red Reflectance
Soil Adjusted Vegetation Index (SAVI) L = 1 For low vegetation density L = 0.5 For intermediate vegetation density; L = 0.25 For high vegetation density.
Soil sensitivity NDVI – soil sensitivity SAVI – soil sensitivity
Atmospheric Resistant Vegetation Index The resistance of the ARVI to atmospheric effects (in comparison to the NDVI) is accomplished by a self-correction process for the atmospheric effect on the red channel, using the difference in the radiance between the blue and the red channels to correct the radiance in the red channel. = 1.0
Enhanced Vegetation Index(EVI) Soil Background Correction SoilAdjusted VegetationIndex EnhancedVegetation Index The ultimate index! Normalized Difference Vegetation Index AtmosphericResistant Vegetation Index Atmospheric Resistance
Enhanced Vegetation Index (EVI) The enhanced vegetation index (EVI) was developed to optimize the vegetation signal with improved sensitivity in high biomass regions and improved vegetation monitoring while correcting for canopy background signals reducing atmosphere influences. where are atmospherically-corrected or partially atmosphere corrected (Rayleigh and ozone absorption) surface reflectances, L is the canopy background adjustment term, and C1, C2 are the coefficients of the aerosol resistance term, which uses the blue band to correct for aerosol influences in the red band. The coefficients adopted in the EVI algorithm are, L=1, C1 = 6, C2 = 7.5, and G (gain factor) = 2.5.
Enhanced Vegetation Index (EVI) EVI Image of Riparian, Wetland, and Agricultural Areas along the Lower Colorado River and U.S.-Mexico Border
Blue Shift of the Red edge Red Edge Blue Shift
Red Edge Position B10 B9 B8 B7
Red edge position Reflectance 1st Derivative 2nd Derivative
Red edge position False color image 2nd derivative image
Vegetation Indices – summary (1) Simple Ratio: Normalized Difference Vegetation Index: Perpendicular Vegetation Index:
Vegetation Indices (2) Soil Adjusted Vegetation Index: Atmospheric Resistance Vegetation Index: Enhanced Vegetation Index: