Analyzing Univariate Data: Patterns and Deviations in Quantitative Variables
100 likes | 233 Views
This guide explores univariate data analysis, focusing on identifying overall patterns and deviations within datasets, such as dotplots and stemplots. We examine the shape, center, and spread of distributions to understand the underlying characteristics of data. The discussion includes specific examples, including analyzing gas mileage of vehicles and electric bills. By recognizing patterns and outliers, we can make informed decisions, such as assessing whether to purchase electricity from PECO. Challenge yourself with independent practice problems to enhance your analytical skills.

Analyzing Univariate Data: Patterns and Deviations in Quantitative Variables
E N D
Presentation Transcript
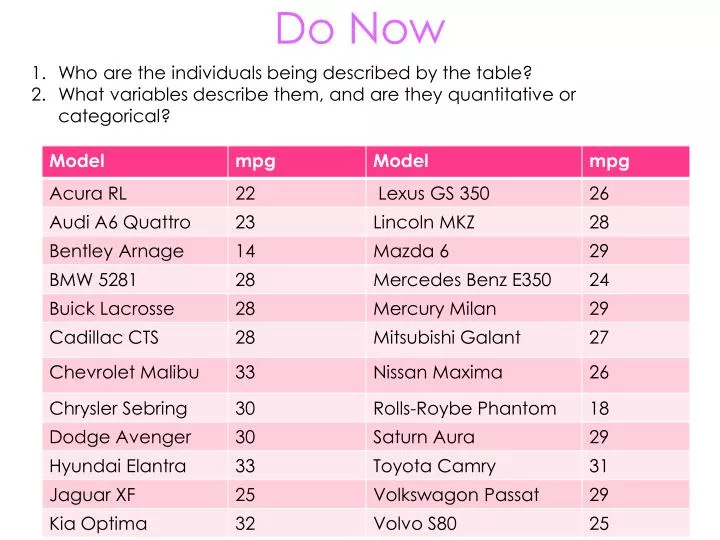
Do Now Who are the individuals being described by the table? What variables describe them, and are they quantitative or categorical?
Patterns and Deviations Unit 1: Univariate Data
Objectives • Identify overall patterns and deviations in dotplots and stemplots.
Overall Pattern • Shape: Symmetric or skewed • Center: The midpoint of the distribution • Spread: The smallest and largest values, ignoring outliers.
Deviations • Outlier: an individual observation that falls outside the overall pattern of the graph
Displaying Quantitative Data: DotplotsAre you driving a gas guzzler?
Overall Pattern and Deviations • Overall Pattern • Shape: The shape of the distribution is skewed with most cars having higher mpg and only a few cars having lower mpg. • Center: The center of the distribution is around 28-29 mpg. • Spread: Excluding outliers, mpg ranged from 22 to 33. • Outliers • Solution: We see two cars with unusually low gas mileage, Bentley Arnage and Rolls-Royce Phantom (14 and 18 mpg).
Overall Patterns: Stemplots The stemplot displays electric bills in dollars for a sample of 33 PECO users. Describe the overall pattern and any deviations. How would this information help you make a decision about whether or not to purchase electricity through PECO? Shape: Symmetric Center: Around $60 Spread: Excluding outliers, the bills range from $35 to $96. Outliers: There is one bill that was only $16!
Independent Practice and Homework • Khan Academy: HSS.ID.A.1 • HSS.ID.A.2 • HSS.ID.A.3


