Generating Scheme Options and Exploring Distributional Impacts
280 likes | 398 Views
The final workshop of the DISTILLATE programme, held on January 22, 2008, at Great Minster House, London, aimed to develop innovative methods for generating options in community space design through participatory GIS. Participants explored various strategies to enhance urban street spaces, focusing on stakeholder input to identify needed changes and promote community engagement. The session emphasized the importance of visual tools like Blocks and Bytes to translate complex design elements into understandable options, allowing for meaningful public participation and fostering innovative solutions to urban challenges.

Generating Scheme Options and Exploring Distributional Impacts
E N D
Presentation Transcript
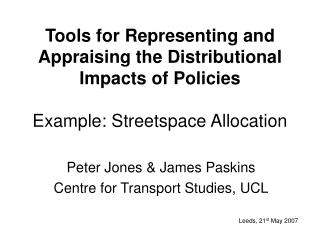
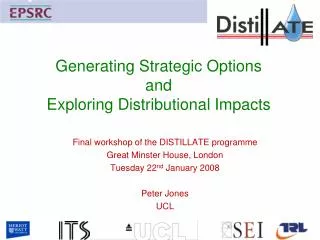
Generating Scheme OptionsandExploring Distributional Impacts Final workshop of the DISTILLATE programme Great Minster House, London Tuesday 22nd January 2008 James Paskins UCL 1
Objectives • To develop option generation methods • To enhance the range, innovation and quality of options • For strategies and schemes
Facilitating Community Space Design Using Participatory GIS to generate options
Problem Features – What do people want to see changed?
Future Changes - What do people want to see happen? Business-as-usual minor infrastructure improvements Pedestrian priority Major changes to promote community use of the space
Out-of-the-Box Options • Participants were encouraged to consider and justify their suggestions • They were guided through this using flow chart • This helped to identify alternative ‘out-of-the-box’ solutions For example: What would you change? Improve the car park How? More disabled bays and better signage Why do you want this change? Improve safety of users How else could you make the area feel safer? Stop the kids hanging around How would you do to achieve this? Put in facilities for kids • So a ‘solution’ to a ‘transport’ issue – might be better play facilities
Designing Streetspace Options • Urban street design often causes major controversy – difficult to gain public support • Conventionally engineers develop a preferred solution, which goes to consultation • Little attention paid to options: • Which street design elements are included? • How many and when? • Where are they located?
The Tools: ‘Blocks’ & ‘Bytes’ • For use in more complex streets, where have many competing street user groups • Two complementary techniques: • Physical design exercise with local communities: scale plans, blocks, acetates • Conversion to electronic, GIS format, for use in larger public meetings and for developing engineering drawings
Tool 1 - Blocks • By using blocks to scale, and detailed maps of the high street: • Users are made aware of many of the component options for allocating street space • They then generate their own options, by combining blocks in different ways and locations • Maps to scale allow users to work within the constraints that the engineers, face without having to have a detailed knowledge.
60mm Example of Loading Bay Block 1:250
Blocks – Colour and Size • Use of colour to denote different types of space usage • Some of these based on current street colour categories, e.g. blue denotes disabled parking (blue badge)
Tool 2 - Bytes • Based on a development of LineMap, a GIS based tool developed by Buchanan Computing to plot road markings • The software plots all road markings from Traffic Signs Regulations and General Directions (TSRGD) 2002 • Now converts to/from the block format, and can be edited on screen
Display Bus on Bloxwich High Street The display includes the full plan, information about red routes and a description of the planning process.
Conclusions • Using scale blocks and maps makes the design process as simple as possible to understand, and highlights opportunities and constraints • LineMap provides a bridge between outline design and professional drawings – suitable for use in larger public meetings for scheme editing • Enables councils to regain confidence of local people and plan with a wider understanding of the needs of an area. • Allows members of the public to participate in street design and encourages innovative solutions • High level of public support for resulting scheme • Council very pleased with outcome – removes normal confrontational approach • Walsall has purchased copies of both tools, and plans to repeat in other parts of the Borough, where face major opposition
Identifying Distributional Impacts Inputs Impacts
Benefits Matrix The impact calculations rely on a matrix that specifies whether a design element has a positive or negative impact for a particular user group
Fine Tuning the Comparisons • Weightings can be applied to • User groups • Street design elements • Individual user group/element pairs • Adjusting the weights allows the comparison to reflect the relative importance of particular user groups or street design elements • Values in the matrix can be adjusted to show the particular importance of a design element to a particular group – for instance, disabled parking bays for disabled drivers
Using Alternative Relationships • The default relationship between street design element and impact is linear • Different relationships, such as maximum provision and diminishing returns, can be applied to each street design element
Comparison area Group 1 scheme Group 2 scheme Existing provision Final scheme
Weighted versus Unweighted • The following sheet shows the results of two types of scheme comparison • Unweighted comparison • Comparison with the following weights and relationships: • Diminishing impact of increasing parking provision 10% per space for reduction for increases above 20 spaces after 20 for all user groups • Priority for bus users A weight of 2 given to bus stops for all user groups • Representing the decreased usefulness of standard parking bays for disabled car users A weight of 0.5 given to standard parking spaces for disabled car users
Spreadsheet Conclusions • The spreadsheet provides an objective and flexible framework for helping to compare different plan options • Careful thought is required about the weightings and relationships that are chosen • Policy priorities • Usage patterns • The spreadsheet fits in well with the option generation techniques that have been developed as part of DISTILLATE
Questions? Contact Professor Peter Jones Centre for Transport Studies peter.jones@ucl.ac.uk Tel: 020 7679 0478 www.distillate.ac.uk