Download

1 / 23
230 likes | 363 Views
Sampling Distributions of Proportions. Parameter. A number that describes the population Symbols we will use for parameters include m - mean s – standard deviation p – proportion (p) a – y-intercept of LSRL b – slope of LSRL. Statistic.

E N D
Parameter • A number that describes the population • Symbols we will use for parameters include m - mean s – standard deviation p – proportion (p) a – y-intercept of LSRL b – slope of LSRL
Statistic • A number that that can be computed from sample data without making use of any unknown parameter • Symbols we will use for statistics include x – mean s– standard deviation p– proportion a– y-intercept of LSRL b– slope of LSRL
The dotplot is a partial graph of the sampling distribution of all sample proportions of sample size 20. If I found all the possible sample proportions – this would be approximately normal! • Toss a penny 20 times and record the number of heads. • Calculate the proportion of heads & mark it on the dot plot on the board. What shape do you think the dot plot will have?
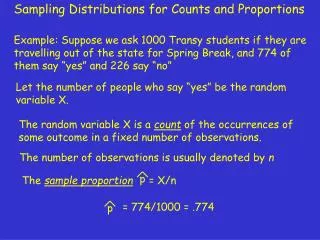
Where x is the number in the sample & n is the sample size Sampling Distribution • Is the distribution of possible values of a statistic from all possible samples of the same size from the same population • In the case of the pennies, it’s the distribution of all possible sample proportions (p) We will use: p for the population proportion and p-hat for the sample proportion
Suppose we have a population of six people: Alice, Ben, Charles, Denise, Edward, & Frank We are interested in the proportion of females. This is called What is the proportion of females? Draw samples of two from this population. How many different samples are possible? The parameter of interest 1/3 6C2 =15
Alice & Ben .5 Alice & Charles .5 Alice & Denise 1 Alice & Edward .5 Alice & Frank .5 Ben & Charles 0 Ben & Denise .5 Ben & Edward 0 Ben & Frank 0 Charles & Denise .5 Charles & Edward 0 Charles & Frank 0 Denise & Edward .5 Denise & Frank .5 Edward & Frank 0 Find the 15 different samples that are possible & find the sample proportion of the number of females in each sample. How does the mean of the sampling distribution (mp-hat) compare to the population parameter (p)? mp-hat = p Find the mean & standard deviation of all p-hats.
Suppose we have a population of six people: Alice, Ben, Charles, Denise, Edward, & Frank Draw samples of three from this population. How many different samples are possible? Find the mean & standard deviation of all p-hats. What do you notice about the means & standard deviations? 6C3 = 20
Formulas: These are found on the formula chart!
Correction factor – multiply by Does the standard deviation of the sampling distribution equal the equation? NO - So – in order to calculate the standard deviation of the sampling distribution, we MUST be sure that our sample size is less than 10% of the population! WHY? We are sampling more than 10% of our population! If we use the correction factor, we will see that we are correct.
Assumptions (Rules of Thumb) • Sample size must be less than 10% of the population (independence) • Sample size must be large enough to insure a normal approximation can be used. np > 10 & n (1 – p) > 10
Why does the second assumption insure an approximate normal distribution? Remember back to binomial distributions Suppose n = 10 & p = 0.1(probability of a success), a histogram of this distribution is strongly skewed right!
Normal Approximation to the Binomial Before widespread use of technology, binomial probability calculations were very tedious. Let’s see how statisticians estimated these calculations in the past!
Premature babies are those born more than 3 weeks early. Newsweek (May 16, 1988) reported that 10% of the live births in the U.S. are premature. Suppose that 250 live births are randomly selected and that the number X of the “preemies” is determined. What is the probability that there are between 15 and 30 preemies, inclusive? (POD, p. 422) 1) Find this probability using the binomial distribution. 2) What is the mean and standard deviation of the above distribution? P(15<X<30) = binomialcdf(250,.1,30) – binomialcdf(250,.1,14) =.866 m = 25 & s = 4.743
Let’s graph this distribution – • Put the numbers 1-45 in L1 • In L2, use binomialpdf to find the probabilities. 3) If we were to graph a histogram for the above binomial distribution, what shape do you think it will have? 4) What do you notice about the shape? Since the probability is only 10%, we would expect the histogram to be strongly skewed right. • Overlay a normal curve on your histogram: • In Y1 = normalpdf(X,m,s)
Think about how discrete histograms are made. Each bar is centered over the discrete values. The bar for “1” actually goes from 0.5 to 1.5 & the bar for “2” goes from 1.5 to 2.5. Therefore, by adding or subtracting .5 from the discrete values, you find the actually width of the bars that you need to estimate with the normal curve. Normal distributions can be used to estimate probabilities for binomial distributions when: 1) the probability of success is close to .5 or 2) n is sufficiently large Rule: if n is large enough, then np> 10 & n(1 –p) > 10 Since a continuous distribution is used to estimate the probabilities of a discrete distribution, a continuity correction is used to make the discrete values similar to continuous values.(+.5 to discrete values) Why?
np = 250(.1) = 25 & n(1-p) = 250(.9) = 225 Yes, Ok to use normal to approximate binomial (Back to our example) Since P(preemie) = .1 which is not close to .5, is n large enough? 5) Use a normal distribution with the binomial mean and standard deviation above to estimate the probability that between 15 & 30 preemies, inclusive, are born in the 250 randomly selected babies. Binomial written as Normal(w/cont. correction) P(15 < X < 30) 6) How does the answer in question 6 compare to the answer in question 1 (Binomial answer =0.866)? P(14.5 < X < 30.5) = Normalcdf(14.5,30.5,25,4.743) = .8635
Assumptions (Rules of Thumb) • Sample size must be less than 10% of the population (independence) • Sample size must be large enough to insure a normal approximation can be used. np > 10 & n (1 – p) > 10
Chip Activity: • Select three samples of size 5, 10, and 15 and record the number of blue chips. • Place your proportions on the appropriate dotplots. What do you notice about these distributions?
Based on past experience, a bank believes that 7% of the people who receive loans will not make payments on time. The bank recently approved 200 loans. What are the mean and standard deviation of the proportion of clients in this group who may not make payments on time? Are assumptions met? What is the probability that over 10% of these clients will not make payments on time? Yes – np = 200(.07) = 14 n(1 - p) = 200(.93) = 186 Ncdf(.10, 1E99, .07, .01804) = .0482
Suppose one student tossed a coin 200 times and found only 42% heads. Do you believe that this is likely to happen? Find the probability that a coin would land heads less than 42% of the time. np = 200(.5) = 100 & n(1-p) = 200(.5) = 100 Since both > 10, I can use a normal curve! Find m & s using the formulas. No – since there is approximately a 1% chance of this happening, I do not believe the student did this.
Assume that 30% of the students at NSHS wear contacts. In a sample of 100 students, what is the probability that more than 35% of them wear contacts? Check assumptions! mp-hat = .3 & sp-hat = .045826 np = 100(.3) = 30 & n(1-p) =100(.7) = 70 Ncdf(.35, 1E99, .3, .045826) = .1376