Download
1 / 19
190 likes | 393 Views
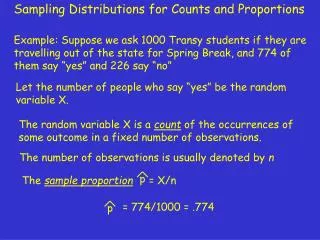
Sampling Distributions of Proportions. The dotplot was a partial graph of the sampling distribution of all sample proportions of sample size 40. If we found all the possible sample proportions – this would be approximately normal!. Remember the skittles example.

E N D
The dotplot was a partial graph of the sampling distribution of all sample proportions of sample size 40. If we found all the possible sample proportions – this would be approximately normal! • Remember the skittles example. • We calculated the proportion of orange skittles & marked it on the dot plots on the board. What shape did the n=40 dot plot have?
Sampling Distribution • Choose an SRS of size n from a large population with population proportion p having some characteristic of interest. Let p-hat be the proportion of the sample having that characteristic.. • We need to come up with some formulas for the mean and standard deviation.
Suppose we have a population of six people: Melissa, Jake, Charles, Kelly, Mike, & Brian What is the proportion of females? What is the parameter of interest in this population? Draw samples of two from this population. How many different samples are possible? 1/3 Proportion of females 6C2 =15
Melissa & Jake .5 Melissa & Charles .5 Melissa & Kelly 1 Melissa & Mike .5 Melissa & Brian .5 Jake & Charles 0 Jake & Kelly .5 Jake & Mike 0 Jake & Brian 0 Charles & Kelly .5 Charles & Mike 0 Charles & Brian 0 Kelly & Mike .5 Kelly & Brian .5 Mike & Brian 0 Find the 15 different samples that are possible & find the sample proportion of the number of females in each sample. How does the mean of the sampling distribution (mp-hat) compare to the population parameter (p)? mp-hat = p Find the mean & standard deviation of all p-hats.
Formulas: The mean of the sampling distribution. The standard deviation of the sampling distribution.
Does the standard deviation of the sampling distribution equal the equation? NO - WHY? So – in order to calculate the standard deviation of the sampling distribution, we MUST be sure that our sample size is less than 10% of the population! We are sampling more than 10% of our population!
Assumptions (Rules of Thumb) • Use this formula for standard deviation when the population is sufficiently large, at least 10 times as large as the sample. • Sample size must be large enough to insure a normal approximation can be used. We can use the normal approximation when np> 10 & n (1 – p) > 10
Why does the second assumption insure an approximate normal distribution? Remember back to binomial distributions Suppose n = 10 & p = 0.1 (probability of a success), a histogram of this distribution is strongly skewed right! np > 10 & n(1-p) > 10 insures that the sample size is large enough to have a normal approximation! Now use n = 100 & p = 0.1(Now np > 10!) While the histogram is still strongly skewed right – look what happens to the tail!
Based on past experience, a bank believes that 7% of the people who receive loans will not make payments on time. The bank recently approved 200 loans. What are the mean and standard deviation of the proportion of clients in this group who may not make payments on time? Are assumptions met? What is the probability that over 10% of these clients will not make payments on time? Yes – np = 200(.07) = 14 n(1 - p) = 200(.93) = 186 Ncdf(.10, 1E99, .07, .01804) = .0482
Example #1 A polling organization asks an SRS of 1500 first year college students whether they applied for admission to any other college. In fact, 35% of all first-year students applied to colleges besides the one they are attending. What is the probability that the random sample of 1500 students will give a result within 2 percentage points of the true value? STATE PLAN DO CONCLUDE
Example #1 STATE: We want to know the probability that a random sample yields a result within 2 percentage points of the true proportion. We want to determine
Example #1 PLAN: We have drawn an SRS of size 1500 from the population of interest. The mean of the sampling distribution of p-hat is 0.35:
Example #1 PLAN: We can assume that the population of first-year college students is over 15,000, and are safe to use the standard deviation formula: In order to use a normal approximation for the sampling distribution, the expected number of successes and failures must be sufficiently large: Therefore,
Example #1 DO: Perform a normal distribution calculation to find the desired probability:
Example #1 CONCLUDE: About 90% of all SRS’s of size 1500 will give a result within 2 percentage points of true proportion.
Example #2 Suppose one student tossed a coin 200 times and found only 42% heads. Do you believe that this is likely to happen? np = 200(.5) = 100 & n(1-p) = 200(.5) = 100 Since both > 10, I can use a normal curve! Find m & s using the formulas. No – since there is approximately a 1% chance of this happening, I do not believe the student did this.
Example #3 Assume that 30% of the students at HH wear contacts. In a sample of 100 students, what is the probability that more than 35% of them wear contacts? Check assumptions! mp-hat = .3 & sp-hat = .045826 np = 100(.3) = 30 & n(1-p) =100(.7) = 70 Ncdf(.35, 1E99, .3, .045826) = .1376
Example #4 (Your turn) • About 11% of American adults are black. Therefore, the proportion of blacks in an SRS of 1500 adults should be close to .11. If a national sample contains only 9.2% black, should we suspect that the sampling procedure is somehow under-representing blacks?