Comparison of Memory Scores in HIV-Infected and Uninfected Children at Week 144 of PREDICT Study
10 likes | 124 Views
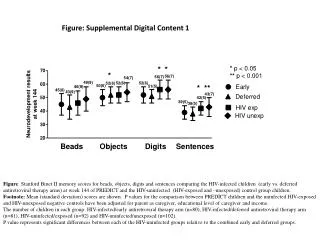
This figure presents memory scores from the Stanford-Binet II test assessing beads, objects, digits, and sentences. The comparison is made between HIV-infected children receiving early versus deferred antiretroviral therapy at week 144 of the PREDICT study, alongside a control group of HIV-uninfected children (both exposed and unexposed). Mean scores and standard deviations are indicated, with P-values adjusted for various demographic factors like caregiver education and income. Results reveal significant differences illustrating the impact of therapy timing on memory development in affected children.

Comparison of Memory Scores in HIV-Infected and Uninfected Children at Week 144 of PREDICT Study
E N D
Presentation Transcript
Figure: Supplemental Digital Content 1 Figure: Stanford Binet II memory scores for beads, objects, digits and sentences comparing the HIV-infected children (early vs. deferred antiretroviral therapy arms) at week 144 of PREDICT and the HIV-uninfected (HIV-exposed and –unexposed) control group children. Footnote: Mean (standard deviation) scores are shown. P values for the comparison between PREDICT children and the uninfected HIV-exposed and HIV-unexposed negative controls have been adjusted for parent as caregiver, educational level of caregiver and income. The number of children in each group: HIV-infected/early antiretroviral therapy arm (n=80), HIV-infected/deferred antiretroviral therapy arm (n=81), HIV-uninfected/exposed (n=92) and HIV-uninfected/unexposed (n=102). P value represents significant differences between each of the HIV-uninfected groups relative to the combined early and deferred groups.