Download
1 / 26
260 likes | 399 Views
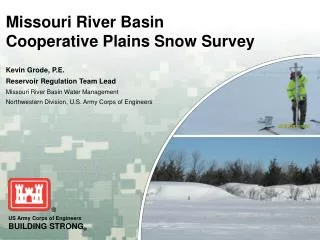
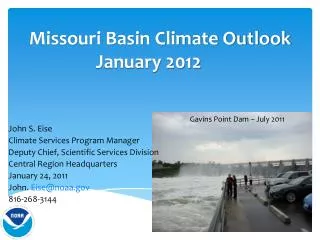
Missouri Basin Climate Outlook January 2012. Gavins Point Dam – July 2011. John S. Eise Climate Services Program Manager Deputy Chief, Scientific Services Division Central Region Headquarters January 24, 2011 John. Eise@noaa.gov 816-268-3144. Key Points. Current Conditions

E N D
Missouri Basin Climate Outlook January 2012 Gavins Point Dam – July 2011 John S. Eise Climate Services Program Manager Deputy Chief, Scientific Services Division Central Region Headquarters January 24, 2011 John. Eise@noaa.gov 816-268-3144
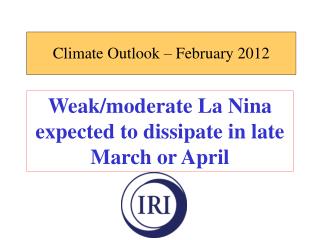
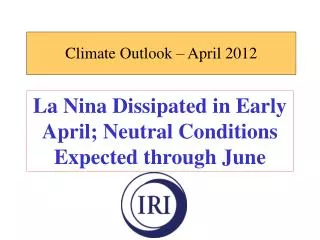
Key Points • Current Conditions • Less snow than last year in plains and mountains • Warmer conditions than last year • La Nina conditions still exist – different manifestation • Predictions • Slightly better chances of cooler over mountains • Slightly better chances of wetter conditions mountains-plains • Arctic Oscillation leaning cooler through end of January, then neutral – La Nina continues through spring • Caveat • Approaching the midpoint of the snow season- still a significant amount of the snow season left.
Typical US Temperature, Precipitation and Jet Stream Patterns during La Niña Winters
The Arctic Oscillation and Winter Impacts over the U.S. Influences the number and intensity of weather events (including extremes) A Winter “Wildcard”: No capability to forecast beyond a week or two.
Soil Moisture Comparison Current Dec. 2011 Jan. 2011 http://www.hydro.washington.edu/forecast/monitor/curr/conus.mexico/main_sm.multimodel.shtml
Mountain Snow Comparison2012 (left) vs 2011 (right) http://www.wcc.nrcs.usda.gov/cgibin/water/drought/wdr.pl
Northern Basin Snow Water Equivalent Comparison Current vs. last month December 14th, 2011 January 18th, 2012 http://www.nohrsc.noaa.gov/nsa/
Northern Basin Snow Water Equivalent Comparison Current vs. last year January 18th, 2011 January 18th, 2012 http://www.nohrsc.noaa.gov/nsa/
Missouri River Snow Pack http://www.nwd-mr.usace.army.mil/rcc/reports/snow.pdf
Precipitation ComparisonDeparture from Normal Since October 1 2012 2011 http://www.hprcc.unl.edu/maps/current/
Temperature ComparisonDeparture from Normal Since October 1 2011-12 2010-11 http://www.hprcc.unl.edu/maps/current/
Climate Outlooks 2 weeks out (8-14 days) February 3 Months (February – March – April) 3 Months (March – April – May) 3 Months (April – May – June) www.cpc.ncep.noaa.gov
PrecipitationRest of January http://ggweather.com/loops/ncep_loops.htm /
February Temperature and Precipitation Probabilities http://www.cpc.ncep.noaa.gov/products/predictions/30day/
February Temperature and Precipitation Probabilities http://www.cpc.ncep.noaa.gov/products/predictions/30day/
3 Month Temperature and Precipitation Probabilities(February –March - April) http://www.cpc.ncep.noaa.gov/products/predictions/long_range/seasonal.php?lead=1
3 Month Temperature and Precipitation Probabilities(March – April - May) http://www.cpc.ncep.noaa.gov/products/predictions/long_range/seasonal.php?lead=2
3 Month Temperature and Precipitation Probabilities(April – May - June) http://www.cpc.ncep.noaa.gov/products/predictions/long_range/seasonal.php?lead=3
Further Information • Climate Situational Awareness Page • http://www.crh.noaa.gov/bis/?n=climate_sa • NOAA’s National Climatic Data Center:www.ncdc.noaa.gov • Monthly climate reports (U.S. & Global): www.ncdc.noaa.gov/sotc/ • NOAA’s Climate Prediction Center: www.cpc.ncep.noaa.gov • Climate Portal: www.climate.gov • U.S. Drought Monitor:www.drought.gov • NRCS National Water & Climate Center: http://www.wcc.nrcs.usda.gov/ • USGS WaterWatch: http://waterwatch.usgs.gov/new/
Thank You and Questions? John Eise john.eise@noaa.gov 816-268-3144 Thanks to Dennis Todey and Doug Kluck
Typical La Nina BehaviorDec-Jan-Feb &Jan-Feb-Mar Temperature Precipitation Snow
Current El Nino/Southern Oscillation (ENSO) Status La Niña Conditions Continue (1/20/11) 29
January ENSO Outlook IRI/CPC Compiled El Nino Southern Oscillation Statistical and Dynamical Models Predictions of what could happen to the El Nino – La Nina cycle over the next year
Typical US Temperature, Precipitation and Jet Stream Patterns during La Niña Winters