1 / 43

2012 Missouri Economic Forecast

2012 Missouri Economic Forecast . Dr . David Mitchell, Director Bureau of Economic Research. US and Missouri Compared (Percent Change in Real GDP by Sector 2009 to 2010). US and Missouri Home Prices (1980:Q1 = 100 ; Constant $1980). 116. 100.

onslow
Download Presentation

2012 Missouri Economic Forecast

An Image/Link below is provided (as is) to download presentation Download Policy: Content on the Website is provided to you AS IS for your information and personal use and may not be sold / licensed / shared on other websites without getting consent from its author. Content is provided to you AS IS for your information and personal use only. Download presentation by click this link. While downloading, if for some reason you are not able to download a presentation, the publisher may have deleted the file from their server. During download, if you can't get a presentation, the file might be deleted by the publisher.

E N D

Presentation Transcript


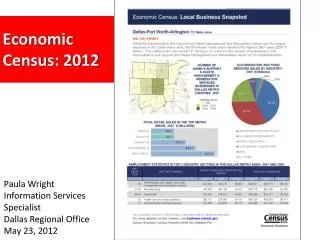
  1. 2012 Missouri Economic Forecast Dr. David Mitchell, Director Bureau of Economic Research

  2. US and Missouri Compared(Percent Change in Real GDP by Sector 2009 to 2010)

  3. US and Missouri Home Prices(1980:Q1 = 100 ; Constant $1980) 116 100

  4. US and Missouri Home PricesYear over Year Percent Change

  5. US and Missouri Home PricesYear over Year Percent Change

  6. New Single Family Home Permitsper 10,000 population 13.7 9.4

  7. Missouri Bank Loans on Balance SheetsReal 2010 $(thds)

  8. Missouri Bank Lending --where is the decline in lending from?

  9. Missouri Personal Income(Constant 2011:Q3 $--SAAR)

  10. Missouri Personal Income(Constant 2011:Q3 $--SAAR) 0.45% Growth

  11. Growth in Missouri Personal Income(Year over Year)

  12. Dollar Change in Real Average Weekly Wages (2010 to 2011)

  13. Dollar Change in Real Average Weekly Wages (2007Q4 to 2011)

  14. Missouri Employment • Peak of 2,917,423 Dec. 2006 • Trough of 2,704,447 Nov. 2010 • 2011 Average 2,759,224 • Current 2,799,208 2011 = Feb. 1997

  15. Missouri Employment (Percent Change Year over Year)

  16. Missouri Employment 2000-2011

  17. Percent Change in County Employment September 2010 to September 2011

  18. Percentage Change in County Employment since Recovery began

  19. Missouri Employment 2000-2015

  20. Missouri Employment in Recovery Index(Employment in Month 1 of Recovery = 100) 107.6

  21. US and Missouri Employment 1.1% 3.75%

  22. Where is Missouri Growing?(January 2011 to today) • Kansas City (14,963) • St. Louis (29,524) • MSA Minor (11,553) • Rural (12,369)

  23. Missouri Employment Breakdown (thds)

  24. Monthly Change in Employment

  25. Construction(thds)

  26. Manufacturing (thds)

  27. Retail (thds)

  28. Government (thds)

  29. Missouri Unemployment Rate

  30. Major City Unemployment Rates

  31. Other Unemployment Rates

  32. Current County Unemployment RateSeptember 2011

  33. Change in County Unemployment RateSeptember 2010 to September 2011

  34. Labor Force in Missouri

  35. Labor Force in Missouri 0.17% CAGR 1.38% CAGR

  36. Millions of Real Missouri Sales Taxes (Fiscal Year)

  37. Millions of Real Missouri Sales Taxes (YTD)

  38. Millions of Real Missouri Corporate Income Taxes (Fiscal Year)

  39. Millions of Real Missouri Corporate Income Taxes (YTD)

  40. Millions of Real Missouri Income Taxes (Fiscal Year)

  41. Millions of Real Missouri Income Taxes (YTD)

  42. 2011 Missouri Forecast(How Accurate?)

  43. 2012 Missouri Forecast

More Related