Decoding Consumer Surveys: Insights and Analysis with Mediamark Online
370 likes | 398 Views
Discover how consumer survey data from Mediamark and Simmons can enhance market research. Explore types of data collected, methodology, limitations, and typical questions. Learn how to access and interpret crosstab reports in Mediamark Reporter for valuable insights.

Decoding Consumer Surveys: Insights and Analysis with Mediamark Online
E N D
Presentation Transcript
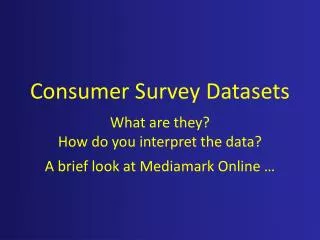
Consumer Survey Datasets What are they? How do you interpret the data? A brief look at Mediamark Online …
Simmons What are they? They are the tabulated, numeric results of huge surveys of many consumers. • The major producers are: • Simmons Market Research Bureau (SMRB) • Mediamark Research Inc. (MRI) Mediamark Research & Intelligence
Types of Data Collected: • Demographics (lots of them!) • Product usage • Brand preferences • Media usage • Media preferences • Lifestyle (psychographics, mostly in Simmons)
Methodology: • Twice-a-year in-depth surveys of 20-30 thousand adult consumers. Includes: • ~10 days of keeping a ‘diary’ of all activities, purchases, consumption, media, etc. • In-person fieldworker interview of household • Data from surveys is ‘projected’ onto annual Census Bureau Population Estimates
Limitations: • Separate studies for minors. • Best for consumer products, not so much for B2B products. • Academic libraries are onlyallowed to buy out-of-date data (1-year-old for Mediamark, 2-years-old for Simmons) • Mediamark is online, but only provides pre-formatted, ‘canned’ crosstab reports • Simmons is cd-rom data (no online access), but has a powerful interface that allows lots of customization
Typical questions: • Demographically, who are the best buyers or customers of product x or brand y? • Demographically, who should the manufacturer target in order to increase market share? • How do I find psychographics for this target group? (Simmons only)
Example questions: • Who are the best customers for Nike athletic shoes? • What demographic group could we target with an ad campaign, in order to try to increase Nike’s market share?
Advertising Let’s briefly look at how to retrieve a crosstab in Mediamark Reporter, which is the easiest to use. Starting from the Libraries’ homepage, here’s how to get to it …
Registration: Use your Marquette email account to register for an account. Both email address and the password you create are case sensitive!! After registering, you’ll receive an email message with an activation link from Mediamark. New User? Register for a FREE Account This account is free to you: the Libraries pay for the subscription to the database … By the way, the database works best with Internet Explorer.
Click on this button to start … A new browser window will be launched, so be sure that your browser allows pop-ups. Mediamark Reporter
Volume Types: Product: profiles who uses different product types, brands, etc. Also includes profiles of behaviors (e.g. leisure activities / hobbies, sports participation, voting, lottery, etc.) Media: profiles the media used by different demographic groups (e.g. by age, occupational group, educational level, etc.). Includes the media quintiles. Magazine Qualitative: provides a qualitative measure of how a magazine is used by readers (e.g. where do they read it, with how much attention and thoroughness, do they take any action after reading it). Magazine Cumulative: provides 4-issue reach and frequency data for each title. Spring 2006 Product Click in the Report Volume selection box to choose a report. This will trigger the appearance of another selection box …
Scroll through the report selections to choose a product type, media user type (demographic group), etc. • You can also search for a keyword. But beware! • ► Keyword searching works best with brand names and other distinctive words. Until you are familiar with the database’s terminology, it can be less useful.
The Search Results and Crosstab display… The left half of this screen shows the search results, and the right half automatically shows a Crosstab for the first result listed. The Crosstab on the right always reflects the variables highlighted on the left.
When you change the selection in the Category box, the variables in the Target box will also change … And so will the crosstab. Athletic Shoes – Brands Bought
Here you see a new Crosstab, reflecting the selections on the left. So now the question is: how do you interpret these numbers?!
Athletic Shoes – Brands Bought: Nike in last 12 months Percent Across 15.1 21.7 23.7 18.2 13.8 8.4 3.4 25.0 21.2 19.1 20.7 18.7 17.9 Percent Down 100.0 18.6 28.5 24.3 17.5 7.5 3.6 25.8 42.9 35.8 21.2 38.2 34.5 Total Age 18-24 Age 25-34 Age 35-44 Age 45-54 Age 55-64 Age 65+ Men 18-34 Men 18-49 Men 25-54 Women 18-34 Women 18-49 Women 25-54 Total ‘000 216,971 28,021 39,430 43,656 41,680 29,077 35,108 33,836 66,218 61,584 33,615 67,007 63,181 Proj ‘000 32,761 6,083 9,332 7,967 5,734 2,456 1,190 8,462 14,062 11,736 6,953 12,529 11,296 Index 100 144 157 121 91 56 22 166 141 126 137 124 118 Percent Across Percent Down Index Then we have three calculated variables … These data are from the Census Bureau’s Annual Population Estimate Survey These data are projected, or extrapolated, from the Mediamark survey results.
Athletic Shoes – Brands Bought: Nike in last 12 months English ‘translation’: People who bought Nike athletic shoes in the past 12 months are 57% more likely to be in the 25-34 age range than the general population. Percent Across 15.1 21.7 23.7 18.2 13.8 8.4 3.4 25.0 21.2 19.1 20.7 18.7 17.9 Percent Down 100.0 18.6 28.5 24.3 17.5 7.5 3.6 25.8 42.9 35.8 21.2 38.2 34.5 Total Age 18-24 Age 25-34 Age 35-44 Age 45-54 Age 55-64 Age 65+ Men 18-34 Men 18-49 Men 25-54 Women 18-34 Women 18-49 Women 25-54 Total ‘000 216,971 28,021 39,430 43,656 41,680 29,077 35,108 33,836 66,218 61,584 33,615 67,007 63,181 Proj ‘000 32,761 6,083 9,332 7,967 5,734 2,456 1,190 8,462 14,062 11,736 6,953 12,529 11,296 Index 100 144 157 121 91 56 22 166 141 126 137 124 118 What is the Index? The Index is a measure of the probability of finding a user in a specific small, group relative to the probability of finding a user in the larger, general population. Also called the ‘propensity to use’ … Index 157
Athletic Shoes – Brands Bought: Nike in last 12 months English ‘translation’: People who bought Nike athletic shoes in the past 12 months are 57% more likely to be in the 25-34 age range than the general population. Percent Across 15.1 21.7 23.7 18.2 13.8 8.4 3.4 25.0 21.2 19.1 20.7 18.7 17.9 Percent Down 100.0 18.6 28.5 24.3 17.5 7.5 3.6 25.8 42.9 35.8 21.2 38.2 34.5 Total Age 18-24 Age 25-34 Age 35-44 Age 45-54 Age 55-64 Age 65+ Men 18-34 Men 18-49 Men 25-54 Women 18-34 Women 18-49 Women 25-54 Total ‘000 216,971 28,021 39,430 43,656 41,680 29,077 35,108 33,836 66,218 61,584 33,615 67,007 63,181 Proj ‘000 32,761 6,083 9,332 7,967 5,734 2,456 1,190 8,462 14,062 11,736 6,953 12,529 11,296 Index 100 144 157 121 91 56 22 166 141 126 137 124 118 How do you get that English ‘translation’? You subtract 100 from the value. If the answer is positive, you say ‘more likely’. Index 157 157 – 100 = + 57%
Athletic Shoes – Brands Bought: Nike in last 12 months Percent Across 15.1 21.7 23.7 18.2 13.8 8.4 3.4 25.0 21.2 19.1 20.7 18.7 17.9 Percent Down 100.0 18.6 28.5 24.3 17.5 7.5 3.6 25.8 42.9 35.8 21.2 38.2 34.5 Total Age 18-24 Age 25-34 Age 35-44 Age 45-54 Age 55-64 Age 65+ Men 18-34 Men 18-49 Men 25-54 Women 18-34 Women 18-49 Women 25-54 Total ‘000 216,971 28,021 39,430 43,656 41,680 29,077 35,108 33,836 66,218 61,584 33,615 67,007 63,181 Proj ‘000 32,761 6,083 9,332 7,967 5,734 2,456 1,190 8,462 14,062 11,736 6,953 12,529 11,296 Index 100 144 157 121 91 56 22 166 141 126 137 124 118 English ‘translation’: People who have bought Nike athletic shoes in the past 12 months are 43% less likely to be in the 55-64 age range than the general population. But if the answer is negative ... Index 57 – 100 = – 43% 56
Index numbers • Index value 100 = dead average for total general population • However, there is really an average ‘range’: 90 – 110, or 85 – 115 • Therefore: index values ≥ 110 are significant index values ≤ 90 are significant
Index = 100 Index = 110 Index = 90 The average range for index values: On this bell curve, all the average probability people fall between the 90 and 110 index lines. The people with greater and lesser probability, statistically speaking, are in the outside triangular areas.
Use high and low index #’s to determine: • Demographics of ‘best’ or core customers • Demographics of low-use customers • Demographics of group to which you might aim an ad campaign.
Index numbers are NOT enough! • Index numbers are always and only comparative, NOT quantitative: they compare data for a small demographic group to the same data for the general population. Classic example: Asian-Americans have high index values (180-200) for the purchase of imported Japanese cars. However, they only constitute ~4.3% of the total population of the US (in 2005). Therefore, they cannot constitute a significant portion of the total number of the buyers of imported Japanese cars.
Vertical % or % down numbers arequantitative! • Use % down/vertical % to see how many of your target group (column variable) also fall into a specific, smaller demographic (row variable). • Mediamark uses the label ‘% down’, and Simmons uses the label ‘vertical %’ – different names for the exact same value.
Athletic Shoes – Brands Bought: Nike in last 12 months Percent Across 15.1 21.7 23.7 18.2 13.8 8.4 3.4 25.0 21.2 19.1 20.7 18.7 17.9 Percent Down 100.0 18.6 28.5 24.3 17.5 7.5 3.6 25.8 42.9 35.8 21.2 38.2 34.5 Total Age 18-24 Age 25-34 Age 35-44 Age 45-54 Age 55-64 Age 65+ Men 18-34 Men 18-49 Men 25-54 Women 18-34 Women 18-49 Women 25-54 Total ‘000 216,971 28,021 39,430 43,656 41,680 29,077 35,108 33,836 66,218 61,584 33,615 67,007 63,181 Proj ‘000 32,761 6,083 9,332 7,967 5,734 2,456 1,190 8,462 14,062 11,736 6,953 12,529 11,296 Index 100 144 157 121 91 56 22 166 141 126 137 124 118 14,062 32,761 X 100 = 42.9% Percent Down 32,761 Good English ‘translations’: Among buyers of Nike athletic shoes in the last 12 months, 42.9% were men aged 25-49. Men aged 25-49 constitute 42.9% of all buyers of Nike athletic shoes in the past 12 months. 14,062 42.9
Index values + vertical %’s = • A good, reliable profile of best customers • A good profile of customer groups to target with an ad campaign The following screen will show a selection of rows that have both a higher index value (two exceptions with a low index value), and higher %’s down.
From these rows, you can easily conclude that Nike buyers … • are younger • are middle-income • have children • are more likely to be minorities • are not the heaviest TV watchers • use Yahoo.com
What you have to figure out are the reasons for the data. For example, Nike buyers are less likely (index=88; %down=19.5) to live in the West, than in the South (index=107; %down=38.6). When you check the crosstabs for competitor brands, you find that in the West, Puma, Vans and other shoe brands are also very popular ... And if you only look at the TV quintile I data (index=86, %down=17.1), you’d think that Nike buyers aren’t heavy TV watchers. However, when you look at the numbers for ESPN (index=124; %down=34.8), pro-football (index=137; %down=29.6) and Comedy Central (index=127; %down=28.1), you see that instead they’re just selective in what they watch.
% across / horizontal % • Horizontal %’s are also quantitative • Use them to see how many of your row group also fall into your target (column) group. • This value is used mostly in media planning (e.g. when buying ads, you’ll need to know what percentage of a magazine’s readership fits into a particular demographic category.) • Know how to read this value, if only so that you can readily distinguish it from the % down / vertical %
Athletic Shoes – Brands Bought: Nike in last 12 months Percent Across 15.1 21.7 23.7 18.2 13.8 8.4 3.4 25.0 21.2 19.1 20.7 18.7 17.9 Percent Down 100.0 18.6 28.5 24.3 17.5 7.5 3.6 25.8 42.9 35.8 21.2 38.2 34.5 Total Age 18-24 Age 25-34 Age 35-44 Age 45-54 Age 55-64 Age 65+ Men 18-34 Men 18-49 Men 25-54 Women 18-34 Women 18-49 Women 25-54 Total ‘000 216,971 28,021 39,430 43,656 41,680 29,077 35,108 33,836 66,218 61,584 33,615 67,007 63,181 Proj ‘000 32,761 6,083 9,332 7,967 5,734 2,456 1,190 8,462 14,062 11,736 6,953 12,529 11,296 Index 100 144 157 121 91 56 22 166 141 126 137 124 118 14,062 66,218 X 100 = 21.2% Percent Across Good English ‘translations’: Among all men aged 18-49, 21.2% bought Nike athletic shoes in the past 12 months. Buyers of Nike athletic shoes in the past 12 months constitute 21.2% of all men aged 18-49. 66,218 14,062 21.2
The % down and % across values tell you about the relationship (or proportions) between three groups of people: those in the row variable, those in the column variable, and those in both. Let’s try looking at the two calculated variables, % down and % across, another way.
Column: Bought Nike’s in last 12 mos. (32,761) Row: Men aged 18-49 (66,218) X: (14,062) • Above is an ordinary Venn diagram representing two of the variables, and their cross-section (X). • (Apologies: the circles are only approximately proportional …) • Now let’s look at how % down and % across are calculated for these variables.
% Down: • 14,062 • 32,761 X 100 = 42.9 % Column: Bought Nike’s in last 12 mos. (32,761) X: (14,062) Here you see that the cross-section of the two variables (X) represents 43% of the total for the column variable (people who bought Nike’s in the last 12 months).
% Across: • 14,062 • 66,218 X 100 = 21.2 % Row: Men aged 18-49 (66,218) X: (14,062) Here you see that the cross-section of the two variables (X) represents 21% of the total for the row variable (men aged 18-49).
Spreadsheet You can easily download a crosstab as a spreadsheet …
And that’s our introduction to consumer survey datasets! What they are, and how to interpret the numbers … For more help with using consumer survey datasets (Mediamark or Simmons), please contact us at the Information Desk. 414.288.7556 Or, fill out the research consultation request form at: http://www.marquette.edu/library/training/consultations.html