Download
1 / 20
200 likes | 344 Views
2011 Consumer Satisfaction Survey. New Mexico Behavioral Health Purchasing Collaborative. The Consumer Satisfaction Project.

E N D
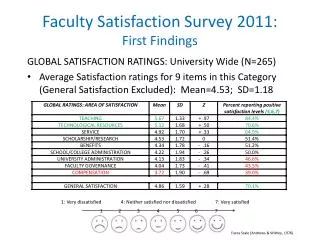
2011Consumer Satisfaction Survey New Mexico Behavioral Health Purchasing Collaborative
The Consumer Satisfaction Project • An annual collaborative effort of the Human Services Department: Behavioral Health Services Division; Medical Assistance Division and Children,Youth and Families Department. • Surveys adults, youth and family members of children who receive state funded behavioral health services. • Participants are randomly selected and participate in either face to face or telephone surveys. • The CSP surveys serve two purposes: • To inform a quality improvement process to strengthen services in New Mexico and • To fulfill federally mandated data reporting requirements.
2011 Survey Respondents & Gender • 1186 individuals participated in the surveys: • 665 Adults • 409 Family Members of Children • 132 Youth • Gender: • Adult and Family Surveys: • 520 Females – 48.34% • 529 Males – 50.19% • 5 Unknown – 0.47% • Youth Survey: • 66 Females – 50% • 63 Males – 48% • 3 Unknown – 2%
2011 Demographics *Includes only White/Non-Hispanic
2011 Demographics Adult & Family Surveyed by Age Range Youths Surveyed by Age Range
Access Entry into behavioral health services is quick, easy and convenient Adult Child/Family • Differences from 2010 and 2011 Surveys • 2 questions decreased slightly: • Location of services (.84 to .83) • Staff sensitive to cultural background(.84 to .83) • All other questions increased • Differences from 2010 and 2011 Surveys • Location of services question decreased (.86 to .82) • Services times available question increased (.86 to .88)
Appropriateness Services are individualized to address a consumer’s strengths and needs, cultural context, preference and recovery goals Adult Child/Family • Differences from 2010 and 2011 Surveys • 1 question had a significant difference: • Encouraged to use consumer run programs increased from .65 to .74 • 9 questions showed an increase • 3 questions showed a decrease • 1 question remained the same • Differences from 2010 and 2011 Surveys • 7 questions showed an increase • 4 questions showed a decrease • 1 question remained the same
Satisfaction Adults, youth, children and families are generally happy with services Adult Child/Family • Differences from 2010 and 2011 Surveys • No questions showed a significant difference from 2010 • All questions experienced an increase in proportion positive • Differences from 2010 and 2011 Surveys • 11 questions showed an increase • 4 questions showed a decrease • 4 questions remained the same • People listen and understand increased from .86 to .92
Effectiveness The extent to which services provided to individuals with behavioral health needs have a positive or negative effect on their well-being, life circumstances and capacity for self-management and recovery Adult Child/Family • Differences from 2010 and 2011 Surveys • 8 questions showed an increase • 11 questions showed a decrease • 1 question remained the same • Child is better able to cope (.76 to .68) • Child is doing better in school/work (.73 to .69) • Differences from 2010 and 2011 Surveys • 1 question had a significant change – I have tools to understand and prevent relapse (.45 to .54) • 18 questions showed an increase • 5 questions showed a decrease • 2 questions remained the same
Empowerment Perception by individuals and families that they have more control over their situations and the available encouragement, support and techniques offered by the providers Adult Child/Family • Differences from 2010 and 2011 Surveys • 1 question had significant difference: • Encouraged to use consumer run programs increased from .65 to .74 • 6 questions showed an increase • 1 question showed a decrease • 1 question remained the same • Differences from 2010 and 2011 Surveys • 5 questions showed and increase • 2 questions showed a decrease • Participated in child’s treatment increased from .93 to .96
Medication Related Questions* • Adult Survey • 27.2% of adults indicated they experienced harmful medication side effects. • 75.4% of adults indicated staff told them what side effects to watch out for. • 80.8% of adults indicated the medications they are taking help control the symptoms that used to bother them. • Family Survey • 16.7% indicated their child experienced harmful medication side effects. • 87.1% indicated staff told them what side effects to watch for regarding prescribed medications for their child. • 81.2% indicated the medications their child is taking helps their child control the symptoms that used to bother him or her. * N/As and blanks removed
Substance Abuse Questions* • Adult Survey • 89.4% of adults indicated they have reduced their abuse of drugs and/or alcohol. • 79.4% of adults indicated they have stopped using drugs and/or alcohol. • 85.5% of adults indicated they have the tools they need to understand and prevent relapse. • Family Survey • 45.5% indicated their child has stopped using drugs and/or alcohol. • 68% indicated their child has the tools he/she needs to understand and prevent relapse. * N/As and blanks removed
Housing* • Adult Survey • 69.2% of adults indicated their housing needs were part of their treatment plan. • 65.4% of adults indicated when they had a housing problem, the staff helped them solve it. • 71.3% of adults indicated their housing situation has improved. • Family Survey • 76.7% indicated their housing needs are part of their child’s treatment plan. • 64.6% indicated when their family has a housing problem, the staff helps us solve it. • 74.5% indicated because of the staffs’ help, their family’s housing situation is better. * N/As and blanks removed – Includes only individuals who indicated housing is important to MH/Recovery
Youth Satisfaction/Families/Relationships • The majority of youth surveyed had lived with one or both parents at some point (81%) over the previous six months • Less than half of the respondents (44%) wereliving with both parents.
Youth Satisfaction/Families/Relationships • 86% of youth agreed or strongly agreed that they were satisfied with their family life at the time of the survey. • 85%of youth agreed or strongly agreed that they got along better with friends and other people outside of family. • 84% of youth agreed or strongly agreed that they were better at handling daily life as well as coping with difficult situations.
Youth Guided TreatmentYouth Access to Treatment When asked if they had helped to choose their services: • Respondents gave the highest number of negative and undecided responses (17% for both). Other negative responses included: • Convenience of location 9% Disagree or Strongly Disagree • Amount of help received in regards to patient’s needs 8% Disagree or Strongly Disagree
Youth Health • 63% of respondents had a health check up in the past year. • 49% were seen in a clinic or office. • 14% were seen in an emergency room. • 27% did not have a check-up in the past year.
Youth Medication 30% of respondents were on medication for emotional or behavioral problems
Youth School Attendance The majority of youth surveyed reported being absent only one or two days during the last month.
2011Consumer Satisfaction Survey Consumer Satisfaction Project Future The Office of Consumer Affairs (OCA) will develop a task force to determine solutions within the communities to address gaps identified in the survey. The Consumer Satisfaction Project Work Team are: • Gathering best practices from other states regarding survey methodology; • Researching the most effective way to use data collected to improve services; • Inviting individuals and family members to engage in the processes with the CSP team. The Consumer Satisfaction Survey Reports and Appendices are available on-line on the New Mexico Behavioral Health Collaborative Website. http://www.bhc.state.nm.us/BHQualityEvaluations/QualityImprovement.html