Download
1 / 55
550 likes | 590 Views
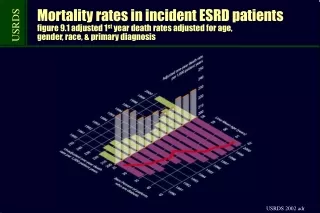
Mortality rates in incident ESRD patients figure 9.1 adjusted 1 st year death rates adjusted for age, gender, race, & primary diagnosis. Mortality rates in prevalent ESRD patients figure 9.2 adjusted 1 st year death rates are adjusted for age, gender, race, & primary diagnosis.

E N D
Mortality rates in incident ESRD patientsfigure 9.1 adjusted 1st year death rates adjusted for age, gender, race, & primary diagnosis
Mortality rates in prevalent ESRD patientsfigure 9.2 adjusted 1st year death rates are adjusted for age, gender, race, & primary diagnosis
Death rates in period prevalent dialysis patients age 65+, by primary diagnosisfigure 9.3, 2000, unadjusted
All-cause mortality in the general Medicare & dialysis populations, patients age 65+, 1999, unadjustedfigure 9.4, period prevalent general Medicare & period prevalent dialysis pts Patients by cardiovascular disease
Geographic variations in all-cause mortality rates in patients age 65+, by patient populationfigure 9.5, period prevalent general Medicare & period prevalent dialysis pts General Medicare Deaths per 1,000 patient years 58.2+ (59.2) 56.5 to <58.2 55.0 to <56.5 52.9 to <55.0 below 52.9 (51.1)
Geographic variations in all-cause mortality rates in patients age 65+, by patient populationfigure 9.5, period prevalent general Medicare & period prevalent dialysis pts Dialysis Deaths per 1,000 patient years 377+ (390) 365 to <377 353 to <365 339 to <353 below 339 (324)
All-cause mortality in the general Medicare & dialysis populations, patients age 65+, by diabetic statusfigure 9.6, period prevalent patients, 1999, unadjusted
All-cause mortality in the general Medicare & dialysis populations, patients age 65+, by genderfigure 9.7, period prevalent patients, 1999, unadjusted
All-cause mortality in the general Medicare & dialysis populations, patients age 65+, by age: 0-44 & 45-64figure 9.8, period prevalent patients, 1999, unadjusted
All-cause mortality in the general Medicare & dialysis populations, patients age 65+, by age: 65-74 & 75+ figure 9.8, period prevalent patients, 1999, unadjusted (cont.)
All-cause mortality in the general Medicare & dialysis populations, patients age 65+, all & whitefigure 9.9, period prevalent patients, 1999, unadjusted
All-cause mortality in the general Medicare & dialysis populations, patients age 65+, Native Am. & Asianfigure 9.9, period prevalent patients, 1999, unadjusted Cardiovascular disease No cardiovascular disease
All-cause mortality in the general Medicare & dialysis populations, patients age 65+, black figure 9.9, period prevalent patients, 1999, unadjusted 450 350 250 150 50 Cardiovascular disease No cardiovascular disease Non-CKD CKD Dialysis Non-CKD CKD Dialysis
All-cause mortality in the general Medicare & dialysis populations, patients age 65+, Hispanicfigure 9.9, period prevalent patients, 1999, unadjusted 450 350 250 150 50 Cardiovascular disease No cardiovascular disease
Mortality rates, by age, race/ethnicity, & genderfigure 9.10, adjusted for diabetic status, eGFR, & BMI
Mortality rates, by age, race/ethnicity, & genderfigure 9.10, adjusted for diabetic status, eGFR, & BMI (cont.)
Relative risk of mortality (with 95% confidence interval)table 9.a, incidence dialysis patients, 1998-1999 combined
Mortality rates, by estimated glomerular filtration rate & racefigure 9.11, adjusted for age, diabetic status, & BMI Deaths per 1,000 patient years
Mortality rates, by estimated glomerular filtration rate, ethnicity & genderfigure 9.11, adjusted for age, diabetic status & BMI (cont.) Deaths per 1,000 patient years
Mortality rates, by body mass index & racefigure 9.12, adjusted for age, diabetic status & eGFR Deaths per 1,000 patient years
Mortality rates, by body mass index, ethnicity & genderfigure 9.12, adjusted for age, diabetic status & eGFR Deaths per 1,000 patient years
Mortality rates in diabetics, by age, race, & gender figure 9.13, adjusted for eGFR & BMI Deaths per 1,000 patient years Age group
Mortality rates in diabetics, by age, ethnicity, & genderfigure 9.13, adjusted for eGFR & BMI Deaths per 1,000 patient years Age group
Mortality rates in non-diabetics, by age, race & gender figure 9.13, adjusted for eGFR & BMI (cont.) Non-diabetic Deaths per 1,000 patient years Age group
Mortality rates in non-diabetics, by age, ethnicity & gender figure 9.13, adjusted for eGFR & BMI (cont.) Non-diabetic Deaths per 1,000 patient years Age group
Relative risk of all-cause mortality (with 95% confidence interval) by gender*table 9.b, incident hemodialysis patients, 1998-1999 combined *Survive the period 4-9 months post ESRD 1st date with factors defined in the entry period or from the ME form, follow-up 1 yr
Relative risk of all-cause mortality (with 95% confidence interval) by race*table 9.c, incident hemodialysis patients, 1998-1999 combined *Survive the period 4-9 months post ESRD 1st date with factors defined in the entry period or from the ME form, follow-up 1 yr
Relative risk of all-cause mortality (with 95% confidence interval) by diabetic status*table 9.d, incident hemodialysis patients, 1998-1999 combined *Survive the period 4-9 months post ESRD 1st date with factors defined in the entry period or from the ME form, follow-up 1 yr
One-year mortality rates, by hemoglobin, gender, race, & diabetic status*figure 9.14, adjusted for age, ethnicity, BMI, & URR *Survive the period 4-9 months post ESRD 1st date with factors defined in the entry period or from the ME form, follow-up 1 yr
One-year mortality rates, by URR, gender, race, & diabetic status*figure 9.15, adjusted for age, ethnicity, BMI, & hemoglobin *Survive the period 4-9 months post ESRD 1st date with factors defined in the entry period or from the ME form, follow-up 1 yr
Mortality rates, by urea reduction ratio, race/ethnicity, & body mass index: whitefigure 9.16, adjusted for age, gender, diabetic status, & hemoglobin
Survival curves by age & gender: IgA nephro./Berger’s, IgM nephropathyfigure 9.17, incident dialysis patients, 1980-2000 combined Months of survival
Survival curves by age & gender: Goodpasture’s syndromefigure 9.18, incident dialysis patients, 1980-2000 combined
Survival curves by age & gender: lupus erythematosus (SLE nephritis)figure 9.19, incident dialysis patients, 1980-2000 combined
Survival curves by age & gender: other secondary GN/vasculitis figure 9.20, incident dialysis patients, 1980-2000 combined
Survival curves by age & gender: scleroderma figure 9.21, incident dialysis patients, 1980-2000 combined
Survival curves by age & gender: Alport’s, other hereditary/familial diseasefigure 9.22, incident dialysis patients, 1980-2000 combined
Survival curves by age & gender: Multiple myeloma & light chain nephropathyfigure 9.23, incident dialysis pts, 1980-2000, adjusted for age, gender, & race
Survival curves, by age & gender: AIDS nephropathyfigure 9.24, incident dialysis patients, 1980-2000 combined, adjusted for age, gender, & race
Expected remaining lifetimes (years) of dialysis & transplant patientstable 9.e, ESRD data: prevalent dialysis & transplant patients, 2000
Expected remaining lifetimes (years) of the general populationtable 9.e, 1999, from the National Vital Statistics Reports
Expected remaining lifetimes in patients with increasing morbidity, by agefigure 9.25, chronic kidney disease & diabetes, prevalent dialysis patients, 2000
Expected remaining lifetimes in patients with increasing morbidity, by agefigure 9.26, diabetes, chronic kidney disease, & chronic heart
Geographic variations in expected remaining lifetimes: age 0-19, dialysisfigure 9.27, prevalent dialysis pts, 2000, by state, unadjusted Years 20.5+ (21.3) 19.6 to <20.5 19.1 to <19.6 18.5 to <19.1 below 185 (175)
Geographic variations in expected remaining lifetimes: age 0-19, transplantfigure 9.27, prevalent transplant pts, 2000, by state, unadjusted Years 50.9 + (53.6) 49.2 to <50.9 47.6 to <49.2 46.2 to <47.6 below 46.2 (43.7)
Geographic variations in expected remaining lifetimes: age 0-19, general Medicarefigure 9.27, 2000, unadjusted Years 57.8+ (60.6) 56.9 to <57.8 54.5 to <56.9 52.4 to <54.5 below 52.4 (49.7)
Geographic variations in expected remaining lifetimes: age 20-44, dialysisfigure 9.27, prevalent dialysis patients, 2000, unadjusted Years 12.0+ (12.5) 11.3 to <12.0 11.0 to <11.3 10.6 to <11.0 below 10.6 (9.7)
Geographic variations in expected remaining lifetimes: age 20-44, transplantfigure 9.27, prevalent transplant patients, 2000, unadjusted Years 35.2+ (37.5) 33.1 to <35.2 32.5 to <33.1 31.3 to <32.5 below 31.3 (29.2)
Geographic variations in expected remaining lifetimes: age 20-44, general Medicarefigure 9.27, 2000, unadjusted Years 41.7+ (43.6) 41.1 to <41.7 39.7 to <41.1 38.3 to <39.7 below 38.3 (36.6)
Geographic variations in expected remaining lifetimes: age 45-64, dialysisfigure 9.27, prevalent dialysis patients, 2000, unadjusted Years 6.0+ (6.3) 5.8 to <6.0 5.5 to <5.8 5.2 to <5.5 below 5.2 (4.8)