Download
1 / 87
1.2k likes | 1.98k Views
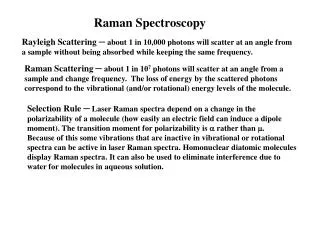
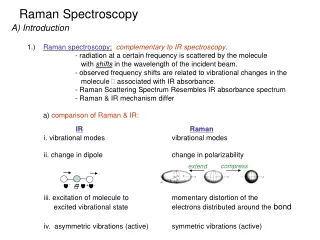
Infrared and Raman Spectroscopy IR and Raman. Electromagnetic Spectrum. The portion of the infrared region most useful for analysis of organic compounds has a wavelength range from 2,500 to 16,000 nm ( 4000~625 cm -1 ), with a corresponding frequency range from 1.9*10 13 to 1.2*10 14 Hz.

E N D
Infrared and Raman Spectroscopy IR and Raman
Electromagnetic Spectrum The portion of the infrared region most useful for analysis of organic compounds has a wavelength range from 2,500 to 16,000 nm (4000~625 cm-1), with a corresponding frequency range from 1.9*1013 to 1.2*1014 Hz.
Infrared Spectroscopy Despite the typical graphical display of molecular structures, molecules are highly flexible and undergo multiple modes of motion over a range of time-frames.
Infrared Spectroscopy Motions involve rotations, translations, and changes in bond lengths, bond angles, dihedral angles, ring flips, methyl bond rotations.
Outline • Introduction • Theory of IR absorption • Instrumentation for IR spectroscopy • Application of IR Spectroscopy
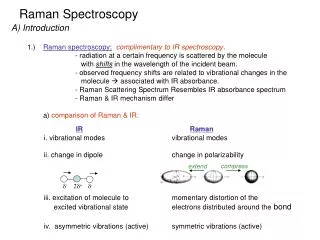
Infrared Spectroscopy • A) Introduction • 1.) Infrared (IR) spectroscopy: based on IR absorption by molecules as undergo vibrational and rotational transitions. rotational transitions Change of dipole moment A Potential Energy (E) Vibrational transitions A Interatomic Distance (r) Potential energy resembles classic Harmonic Oscillator
2.) IR radiation is in the range of 10 ~ 12,800 cm-1 or l = 0.78 – 1000 mm • most useful for analysis of organic compounds has a wavelength range from 625 to 4000 cm-1 • wavelength range from 10 to 650 cm-1 called Far Infrared • wavelength range from 4000 to 12800 cm-1 called Near Infrared • rotational transitions have small energy differences‚ wave number ≤ 100 cm-1, l > 100 mm • rotational and vibrational transitions often occur together
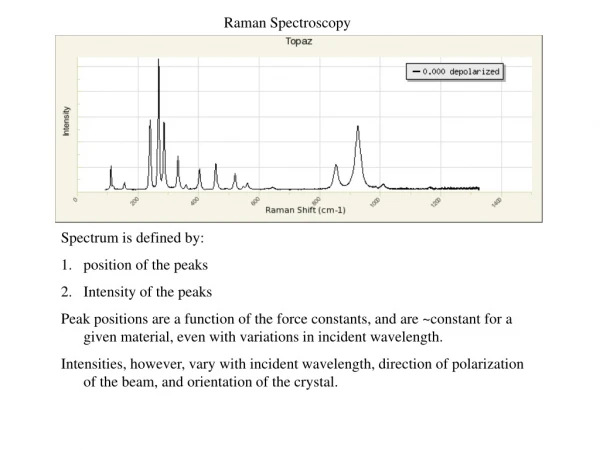
Typical IR spectrum for Organic Molecule % Transmittance Wavenumber (cm-1)
Wide Range of Types of Electromagnetic Radiation in nature. • Only a small fraction (350-780 nM is visible light). • The complete variety of electromagnetic radiation is used throughout spectroscopy. • Different energies allow monitoring of different types of interactions with matter.
3.)Typical IR spectrum for Organic Molecule • - many more bands then in UV-vis, fluorescence or phosphorescence • - bands are also much sharper • -pattern is distinct for given molecule • except for optical isomers • - good qualitative tool • can be used for compound identification and functional group analysis • - also quantitative tool • intensity of bands related to amount of compound present • -spectra usually shown as percent transmittance (instead of absorbance) vs. wavenumber (instead ofl)
C6H14 Hexyne Hexane C6H10, C≡C at 2100~2260 C6H12, C=C at 1610~1680 Hexene
B) Theory of IR Absorption • 1.) Molecular Vibrations • i.) Harmonic Oscillator Model: • - approximate representation of atomic stretching • - two masses attached by a spring E = ½ ky2 where: y is spring displacement k is spring constant
Vibrational frequency given by: • = 1/2p (k/m)1/2 where: n:frequency k: force constant (measure of bond stiffness) m: reduced mass – m1m2/m1+m2 1: Ideal harmonic potential 2. Real molecule
ii.) Anharmonic oscillation: • - harmonic oscillation model is good at low energy levels (n0, n1, n2, …) • - not good at high energy levels due to atomic repulsion & attraction • as atoms approach, columbic repulsion force adds to the bond force making energy increase greater then harmonic • as atoms separate, approach dissociation energy and the harmonic function rises quicker Harmonic oscillation Anharmonic oscillation
iii.) Types of Molecular Vibrations Bond Stretching Bond Bending In-plane rocking symmetric asymmetric In-plane scissoring Out-of-plane wagging Out-of-plane twisting
symmetric asymmetric In-plane scissoring Out-of-plane wagging Out-of-plane twisting In-plane rocking
Describe the types of motion • Translational • Rotational • Vibrational whole atom or molecule changes its location in three dimensional space Motion of whole molecule whole molecule spins around an axis in three dimensional space Motion within molecule motion that changes the shape of the molecule – stretching, bending, and rotation of bonds
iv.) Number of Vibrational Modes: • - for non-linear molecules, number of types of vibrations: 3N-6 • - for linear molecules, number of types of vibrations: 3N-5 • - why so many peaks in IR spectra • - observed vibration can be less then predicted because • symmetry ( no change in dipole) • energies of vibration are identical • absorption intensity too low • frequency beyond range of instrument
Examples: 1) HCl: 3(2)-5 = 1 mode 2) CO2: 3(3)-5 = 4 modes + - - moving in-out of plane • v.) IR Active Vibrations: • - In order for molecule to absorb IR radiation: • vibration at same frequency as in light • but also, must have a change in its net dipole moment • as a result of the vibration
Examples: 1) CO2: 3(3)-5 = 4 modes m = 0; IR inactive d- 2d+ d- m > 0; IR active d- 2d+ d- + - - m > 0; IR active d- 2d+ d- degenerate –identical energy single IR peak 9 2d+ m > 0; IR active d- d-
C) Instrumentation • 1.) Basic Design • - normal IR instrument similar to UV-vis • - main differences are light source & detector
2.) Fourier Transfer IR (FTIR) – alternative to Normal IR • - Based on Michelson Interferometer
2.) Fourier Transfer IR (FTIR) – alternative to Normal IR Principal: 1) light from source is split by central mirror into 2 beams of equal intensity 2) beams go to two other mirrors, reflected by central mirror, recombine and pass through sample to detector 3) two side mirrors. One fixed and other movable a) move second mirror, light in two-paths travel different distances before recombined b) constructive & destructive interference c) as mirror is moved, get a change in signal
傅利葉轉換:扣除background, ratio得到樣品光譜 Background 背景掃瞄 穿透光譜 80.8 60 Ratio %T 40 EGY Sample 樣品掃瞄 20 0.3 4400.0 2000 1000 450.0 cm-1 4400.0 2000 1000 450.0 cm-1
Destructive Interference can be created when two waves from the same source travel different paths to get to a point. • This may cause a difference in the phase between the two waves. • If the paths differ by an integer multiple of a wavelength, the waves will also be in phase. • If the waves differ by an odd multiple of half a wave then the waves will be 180 degrees out of phase and cancel out.
observe a plot of Intensity vs. Distance (interferograms) • convert to plot of Intensity vs. Frequency by doing a Fourier Transform • resolution Dn = 1/Dd(interval of distance traveled by mirror)
Advantages of FTIR compared to Normal IR: 1) much faster, seconds vs. minutes 2) use signal averaging to increase signal-to-noise (S/N) increase S/N %rnumber scans 3) higher inherent S/N – no slits, less optical equipment, higher light intensity 4) high resolution (<0.1 cm-1) Disadvantages of FTIR compared to Normal IR: 1) single-beam, requires collecting blank 2) can’t use thermal detectors – too slow In normal IR, scan through frequency range. In FTIR collect all frequencies at once.
D) Application of IR • 1.) Qualitative Analysis (Compound Identification) • - main application • - Use of IR, with NMR and MS, in late 1950’s revolutionized organic chemistry • ► decreased the time to confirm compound identification 10- 1000 fold • i.) General Scheme • 1) examine what functional groups are present by looking at group frequency region- 3600 cm-1 to 1200 cm-1
ii.) Group Frequency Region • - approximate frequency of many functional groups (C=O,C=C,C-H,O-H) can be • calculated from atomic masses & force constants • - positions changes a little with neighboring atoms, but often in same general region • - serves as a good initial guide to compound identity, but not positive proof.
iii.) Fingerprint Region (1200-700 cm-1) • - region of most single bond signals • - many have similar frequencies, so affect each other & give pattern characteristics of overall skeletal structure of a compound • - exact interpretation of this region of spectra seldom possible because of complexity • - complexity uniqueness Fingerprint Region
iv.) Computer Searches • - many modern instruments have reference IR spectra on file (~100,000 compounds) • - matches based on location of strongest band, then 2nd strongest band, etc overall skeletal structure of a compound • - exact interpretation of this region of spectra seldom possible because of complexity • - complexity uniqueness Bio-Rad SearchIT database of ~200,000 IR spectra
2.)Quantitative Analysis • - not as good as UV/Vis in terms of accuracy and precision • ► more complex spectra • ► narrower bands (Beer’s Law deviation) • ► limitations of IR instruments (lower light throughput, weaker detectors) • ► high background IR • ► difficult to match reference and sample cells • ► changes in e (A=ebc) common • - potential advantage is good selectivity, since so many compounds have different IR • spectra • ► one common application is determination of air contaminants.
Example : The spectrum is for a substance with an empirical formula of C3H5N. What is the compound? Nitrile or alkyne group No aromatics Aliphatic hydrogens One or more alkane groups
Hydrophilic Fe3O4 Nanoparticles Hydrophilic Fe3O4 nanoparticles (H-Fe3O4) Medium: water solvent: hexane solvent: water
Mechanism for Sulfonation Formation of the Electrophile +SO3H for Sulfonation In sulfonation, protonation of sulfur trioxide, SO3, forms a positively charged sulfur species (+SO3H) that acts as an electrophile. H+
FTIR Spectroscopy of SPANI/MWCNT Composites 1150 cm-1: asymmetric O=S=O stretching 1070 cm-1: symmetric O=S=O stretching 815 cm-1:. out-of-plane bending of 1,2,4-trisubstituted aromatic rings 700 cm-1: S-O stretching 605 cm-1: C-S stretching Attached + SO3H
FTIR Transmittance measurement • 固體穿透式技術 • - Mull Cell法 • - KBr鹽片法 • - Cast Films分析法 • - Hot Pressed Films分析法 • - Beam Condenser法 • 液體樣品技術 • 氣體樣品技術
FTIR Transmittance measurement Mull Cell法 適用於 : 可被磨成細粉末之樣品 會與KBr產生離子交換現象,無法使用KBr Disk • 配件內容: • - 使用液狀蠟油 a) Nujol(礦物油1350cm-1) • b) Fluorolube(氟化礦物油40001350cm-1) • 使用配件 a) 瑪瑙研砵及杵 d) 圓形KBr鹽片 • b) 礦物油e) 可拆式Cell Mount • c) 刮刀
FTIR Transmittance measurement KBr 鹽片法 可使用之基質包括 : KBr, KCl, NaCl, KI, CsI 及 PE powder 配件內容: a) 瑪瑙研砵及杵(自動磨碎機) b) 光譜級KBr粉末 c) 紙墊片 d) 13mm鑄模(die) e) 15ton油壓打碇機 f) 13mm 鹽片固定器
Cast Films分析法 塑膠粒或不規則型高分子無法直接使用穿透分析方式,但可使用適當溶劑將之溶解,再滴在鹽片上,溶劑揮發後形成薄膜而進行分析。 Hot Pressed Films分析法 熱壓成膜分析技術一般用於大於或不規則的高分子,將樣品加熱熔融成液狀再加薄膜,可藉由constant thickness film maker來固定膜厚,然後放在磁性薄膜固定器上分析。
FTIR Transmittance measurement 液體樣品槽分為: - 可拆卸式液體樣品槽 - 固定式液體樣品槽 一般液體樣品槽必須含有: 1. 樣品槽本體 2. 鹽片, 可分為不防水鹽片,如NaCl, KBr及防水鹽片,如 CaF2, AgBr, KRS-5 3. Spacer, 分為0.1mm~0.015mm間,一般為鐵弗龍材質, 也有使用銅、鉛材質
Reflection Absorption 正吸收反射 • 樣品表面需光滑面 , 入射角 = 反射角 • 可改變入射角角度 , 來增加 IR 吸收強度 • Grazing Angle Reflectance -- 80-85度, 可量測約分子層之厚度, 光束會變大, IR 光能量減弱 , 需與偏光鏡配合使用 有機物 金屬