Download
1 / 32
320 likes | 351 Views
This study explores estimating annual gas flaring volumes in Asia using satellite data analysis, highlighting the discrepancies in global estimates and emphasizing the significance of monitoring emissions. The research utilizes satellite sensors to detect gas flares and provides valuable insights for global data assessment.

E N D
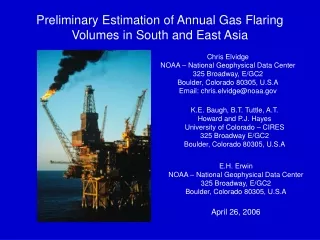
Preliminary Estimation of Annual Gas Flaring Volumes in South and East Asia Chris Elvidge NOAA – National Geophysical Data Center 325 Broadway, E/GC2 Boulder, Colorado 80305, U.S.A Email: chris.elvidge@noaa.gov K.E. Baugh, B.T. Tuttle, A.T. Howard and P.J. Hayes University of Colorado – CIRES 325 Broadway E/GC2 Boulder, Colorado 80305, U.S.A E.H. Erwin NOAA – National Geophysical Data Center 325 Broadway, E/GC2 Boulder, Colorado 80305, U.S.A April 26, 2006
Crude oil contains associated hydrocarbon gases. • When brought to surface the gases are released. • Where there is no market for the gas the industry standard for disposal is flaring. • Venting also occurs – releasing unburnt gases directly into the atmosphere. • Alternatives include reinjection, on-site power generation, and transport to markets. The Gas Flaring Issue Exxon-Mobil Amenam Platform, Nigeria
How Much Gas Is Flared? • A number of countries report gas flaring volumes, but these are not all viewed as reliable. • The World Bank Global Gas Flaring Reduction Initiative (GGFR) estimates that a 150 billion cubic meters (BCM) of gas is flared or vented per year. • This is equivalent to 25% of US consumption. • There is large uncertainty in the estimates since reporting is voluntary and the activity occurs primarily in remote locations. • GGFR 2004 Reported Values • In Billion Cubic Meters (BCM) • Nigeria 24.1 • Russia 14.7 • Iran 13.3 • Iraq 8.6 • Angola 6.8 • Venezuela 5.4 • Qatar 4.5 • Algeria 4.3 • Eq. Guinea 3.6 • Indonesia 3.5 • USA 2.8 • Kazakhstan 2.7 • Azerbaijan 2.5 • Libya 2.5 • Mexico 1.6 • UK 1.6 • Brazil 1.5 • Gabon 1.4 • Cameroon 1.1 • Canada 1.0
Why Not Estimate Gas Flaring Volumes From Satellite Data? • Open combustion produces a unique signature that should be detectable by satellite sensors. • Systematic global observations of gas flaring from satellites could provide estimates free of corporate and national disclosure constraints.
The U.S. Air Force Defense Meteorological Satellite Program (DMSP) Operational Linescan System (OLS) has a Unique capability to collect low-light imagery. Polar orbiting 3000 km swath 2.7 km ground sample distance (GSD) Two spectral bands: visible and thermal Nightly global coverage Flown since 1972 Will continue till ~2012 Visible Thermal
OLS sensor extremely sensitive to light emitted by gas flares. Global archive extending back to 1992. NGDC has standardized and largely automated annual product generation. Lighting detected from many other sources. No onboard calibration of visible band. Gas flares not detected in OLS thermal band data. Pros and Cons of DMSP
Average Digital Number of Lights x Percent Frequency of Detection
Mollweide Projection – 1 km Equal Area Grid Average Digital Number of Lights x Percent Frequency of Detection
Nigeria F162004 = Red F141998 = Green F101992 = Blue Vectors drawn on gas flares.
Russia F162004 = Red F141998 = Green F101992 = Blue Vectors drawn on gas flares. Yellow vectors = Khanty Mansiysk.
Algeria F162004 = Red F141998 = Green F101992 = Blue Vectors drawn on gas flares.
Indonesia F162004 = Red, F141998 = Green, F101992 = Blue Vectors drawn on gas flares.
Malaysia F162004 = Red, F141998 = Green, F101992 = Blue Vectors drawn on gas flares.
India F152003 = Red F141998 = Green F101992 = Blue
Vietnam F152003 = Red F141998 = Green F101992 = Blue
F15 = Blue F16 = Red Russia Excluding KM Khanty Mansiysk F16 BCM = Sum of Lights/33901 R2=0.87 Nigeria F15 BCM = Sum of Lights/28543 R2=0.89 Iraq Iran Angola
2004 Gas Flaring Volumes (BCM) GGFR F15 F16 • Russia 14.7 ??? ??? • Nigeria 24.1 25.8 25.8 • Iran 13.3 11.5 11.4 • Iraq 8.6 9.0 8.7 • Algeria 4.3 7.0 7.2 • Kazakhstan 2.7 6.9 7.3 • Angola 6.8 5.8 5.9 • Saudi Arabia NA 5.2 5.0 • Libya 2.5 4.9 5.0 • UAE NA 3.7 3.7
Estimated 2004 Gas Flaring Volumes (BCM) GGFR F15 F16 • Indonesia 3.5 3.23 3.39 • China NA 2.50 2.23 • Malaysia NA 1.95 2.07 • India NA 0.78 0.75 • Vietnam NA 0.67 0.68 • PNG NA 0.31 0.37 • Thailand NA 0.24 0.21 • Brunei NA 0.118 0.119 • Philippines NA 0.064 0.045 • Myanmar NA 0.036 0.024
Conclusions • The satellite data estimate of global gas flaring volumes is 190-199 BCM in 2004. • This is about 30% higher than the GGFR estimate of 150 BCM. • Russia has the largest flaring – more than 30% of the global total. • Indonesia, China, and Malaysia have the largest amount of flaring in south and east Asia. • NGDC plans to extend the annual estimates back to 1992 using the DMSP archive.