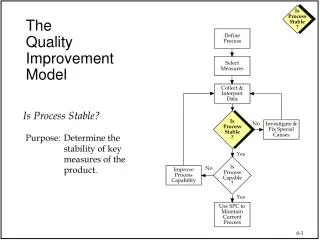
Quality Improvement and the Model for Improvement
540 likes | 1.02k Views
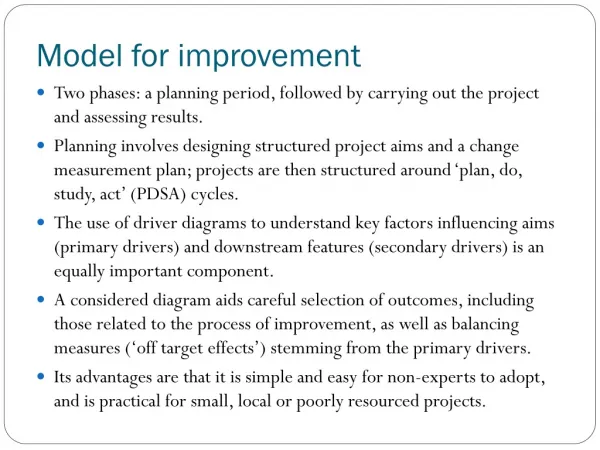
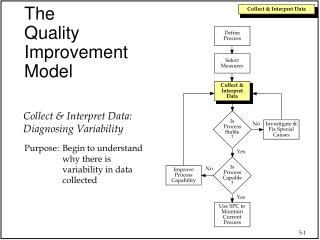
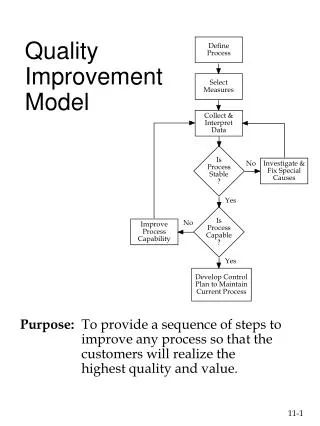
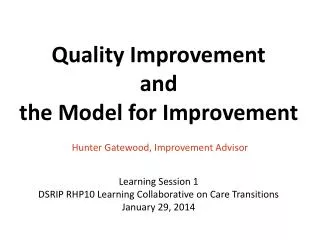
Quality Improvement and the Model for Improvement. Hunter Gatewood, Improvement Advisor. Learning Session 1 DSRIP RHP10 Learning Collaborative on Care Transitions January 29, 2014. What is Quality Improvement?. What is Quality Improvement?. Change at system level

Quality Improvement and the Model for Improvement
E N D
Presentation Transcript
Quality Improvement and the Model for Improvement Hunter Gatewood, Improvement Advisor Learning Session 1 DSRIP RHP10 Learning Collaborative on Care Transitions January 29, 2014
What is Quality Improvement? • Change at system level • Work at the frontline level • By multi-disciplinary staff teams • Regular, ongoing assessment and measurement • Reduction of variability • Process focus, not individual as good/bad Examples • Establish reminder system to reduce no shows • Develop system to identify patients needing LDL test How do we do things better?
What is Quality Assurance? “The planned and systematic activities put in place to ensure that (quality) requirements for a product or service will be fulfilled.” • Ensure that requirements, guidelines, regulations met • Uses inspection (vs. regular measurement) • Also known as quality control • Examples: • Health code for restaurants • Licensing of providers • Audits of clinical facilities Are we (you) doing things right?
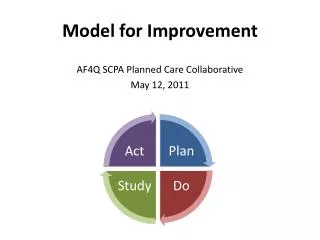
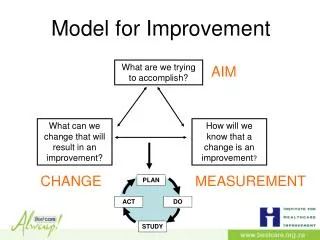
Act Plan Study Do Model for Improvement What are we trying to AIM accomplish? How will we know that a MEASURES change is an improvement? What changes can we make that CHANGES will result in improvement? RAPID TEST OF CHANGES From Associates in Process Improvement.
Model for Improvement, Part 1 Aim Statements Monthly Measures and Run charts but first, 3 more distinctions
Learning Collaboratives, DSRIP projects, and the Model for Improvement Diagram credit: hhs.gov, from original at www.ihi.org
Three DIFFERENT Uses of Numbers Research Judgment Improvement
Other Improvement Models • Six Sigma • LEAN (ToyotaProduction System) • TQM • CQI
Act Plan Study Do Model for Improvement What are we trying to AIM accomplish? How will we know that a change is an improvement? What changes can we make that will result in improvement? From Associates in Process Improvement.
Characteristics of Good Aim • Focused: Sets a clear goal to focus the team • Measurable: can develop clear measures to track progress toward aim • Defines success numerically • Time specific: establishes time frame (6-12 months) • Clinically relevant, compelling • Defines patient population Adapted from the Institute for Healthcare Improvement Breakthrough Series College.
Example Aims • Within 12 months, decrease the percent of patients with >3 ER visits a year. • Within six months, reduce waiting time for primary care appointments in SCC Clinic to Third-next Available Appointment Delay of 3 days or less. • By December 2012, decrease the percentage of diabetic patients with HbA1c > 9 to ten percent. • By {When}, increase/decrease {What} for {Whom}
Assess the Aim: Example 1 • The QI team will meet five times in the next month • Focused: Sets a clear goal to focus the team? • Measurable and defines success numerically? • Time specific? • Clinically relevant? • Defines patient population?
Assess the Aim: Example 2 • By December 2014, increase by 50% the percentage of patients with diabetes who got an HbA1c test in the past 12 months AND have HbA1c < 9%. • Focused: Sets a clear goal to focus the team? • Measurable and defines success numerically? • Time specific? • Clinically relevant? • Defines patient population?
Act Plan Study Do Model for Improvement What are we trying to accomplish? How will we know that a MEASURES change is an improvement? What changes can we make that will result in improvement?
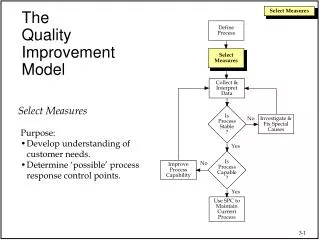
Measurement for Improvement Purpose: To track progress (improvement!) over time and to promote buy-in. Audience: QI Team, Front-line staff and providers, Senior sponsors
RHP10 shared Care Transitions measuresPre-work, Appendix D • Discharge plan to patient % patients who received written plan at time of discharge • Discharge plan to provider % patients whose follow-up provider received discharge summary within 7 days of discharge • Community provider contact % patients with contact within 7 calendar days of discharge
Characteristics of a Good Measure Directly relates to aim Specifies patient population Data are available Able to collect data frequently Worth measuring for at least 12 months
Example Measures Number of days until third next available appointment. Aim: Within six months, reduce waiting time for primary care appointment to 3 days. Percentage of patients with HbA1c >9. Aim: By December 2012, decrease the percentage of diabetic patients with HbA1c > 9 to 10% or less.
Assess the Measure: Example 1 • Number of times the QI team meets each month • Directly relates to aim? • Specifies patient population? • Data are available? • Able to collect data frequently? Aim: The QI Team will meet 5 times in the next month
Assess the Measure: Example 2 • Number of improvements to the care of patients with diabetes • Directly relates to aim? • Specifies patient population? • Data are available? • Able to collect data frequently? Aim: Improve the care of diabetic patients over the next 12 months
Assess the Measure: Example 3 • Percentage of patients with HbA1c testing during past 12 months • Directly relates to aim? • Specifies patient population? • Data are available? • Able to collect data frequently? Aim: By December 2012, 90% of DM pts. will have had an A1c in the past 12 months.
Sample Run Chart Median
Run Charts • Display ordered sequence of data and provide running record over time • Can be used for any data that are sequenced over time (trending) • Require no statistics • Visually illustrate progress toward goal Adapted from, NHS Scotland Tutorial Guide on Statistical Process Control. http://www.indicators.scot.nhs.uk/SPC/SPC.html
Understanding Variation • All sets of data demonstrate variation. • Two types of variation • Random/common cause (NOT special; regular) • Special cause (something going on) Adapted from, NHS Scotland Tutorial Guide on Statistical Process Control. http://www.indicators.scot.nhs.uk/SPC/SPC.html
Common Cause Variation • Inherent in the design of the process • Normal fluctuations due to everyday reasons • Process is “in control” – variation is predictable • Nothing out of the ordinary • Example: Arrival time to work
Special Cause Variation • Due to unexpected events • NOT inherent in design of the process • Generally infrequent • Suggests that process or system is “unstable” or “out of control” • Also known as “assignable” variation • Philosophy of statistical process control identify and address special cause variation
Detecting Special-Cause Variation Four run chart rules • Astronomical point • Shift • Trend • Number of runs
Change Made 1. 2. Change Made 3. Change Made 30
Benefits of Run Charts • Tells story visually • Focuses on the process • Prevents jumping to unfounded conclusions about what does/doesn’t work • Motivates people to think like improvers
Test changes small, using the Plan-Do-Study-Act Cycle Model for Improvement, Part 2
Act Plan Study Do Model for Improvement What are we trying to accomplish? How will we know that a change is an improvement? What changes can we make that will result in improvement? From Associated in Process Improvement
Learning Objectives Learn the value of testing changes in care on a small scale before implementing widely Learn how to turn your ideas into tests (PDSAs) Plan a PDSA test to complete when you return to work
Why do Small Tests of Change? Adapted from the Institute for Healthcare Improvement Breakthrough Series College. • Understand the likelihood that change will result in improvement • Understand the extent and limitations of the change • Learn to adapt the change to local environment • Evaluate cost • Address unexpected consequences • Gain buy-in and minimize resistance if change is implemented and spread 36
PDSA – Rapid Cycle Improvement • Questions & predictions (why?) • Plan to carry out the cycle Act Plan Do • Complete analysis • Compare data to predictions • Summarize what was learned Adapt Adopt Abandon • Carry out plan • Document • Begin data analysis Study Adapted from the Institute for Healthcare Improvement Breakthrough Series College.
PDSA STEP by STEP • Identify a daily process need/problem • Brainstorm possible solutions • Choose one to test • Write a PLAN for your test • DO it! Conduct the test and document the data. • STUDY the data to determine whether or not this test solved the problem • Take ACTion-your most logical next step to solve the problem or retest for effectiveness
Example of PDSA Subject: Diabetes: Planned visits for blood sugar management. Plan: Ask one patient if he or she would like more information on how to manage his or her blood sugar. (Predict: Patient will say “yes”) Do: Dr. J. asked his first patient with diabetes on Tuesday. Study: Patient was interested; Dr. J. was pleased at the positive response. Act: Dr. J. will continue with the next five patients and set up a planned visit for those who say yes. Source: ihi.org
Exercise • Stand in groups of 8 • Get one tennis ball for your group • Pick team’s timekeeper • Name your team, quickly
“Hey, Let’s go See Homer Blow Himself up.” Video: “October Sky” Scene 6, “Rocket Roulette” (from 34:37 to 41:00)
A P S D D S P A A P S D A P S D Repeated Uses of PDSA Cycle Changes That Result in Improvement DATA Implementation of Change Wide-Scale Tests of Change Follow-up Tests Hunches Theories Ideas Very Small Scale Test Adapted from the Institute for Healthcare Improvement Breakthrough Series College.
Keys to Successful Small Tests of Change • Scale down: do small tests • Collect useful data during each test • Test over a wide range of conditions Adapted from the Institute for Healthcare Improvement Breakthrough Series College.
P P P P A A A A D D D D S S S S S S S S D D D D A A A A P P P P A A A A P P P P S S S S D D D D P P P P A A A A D D D D S S S S Run PDSAs in Parallel Specific Test Cycles Implement registry Group Visits Workflow redesign Team care approach Adapted from the Institute for Healthcare Improvement Breakthrough Series College.
Using a PDSA Worksheet • PLAN: activities and timelines, including person responsible • DO: describe what actually happened during test • STUDY: review data collected during plan phase and compare to predictions • ACT: determine what to change and what to keep based on previous plan cycle (this is a new PLAN)