Enhancing Process Stability & Capability with Quality Improvement
650 likes | 767 Views
Learn how to diagnose, solve, and improve processes with the quality improvement model. Discover systematic actions to address special causes and maintain process control. Enhance stability, capability, and system efficiency.

Enhancing Process Stability & Capability with Quality Improvement
E N D
Presentation Transcript
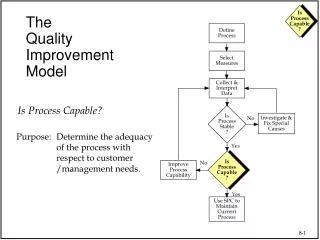
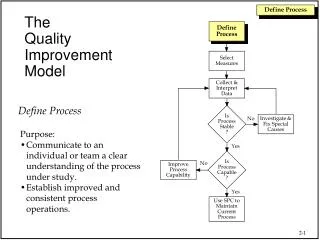
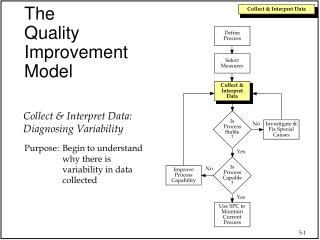
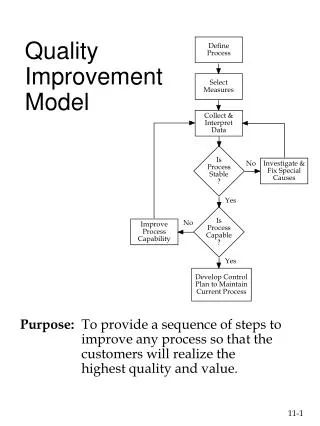
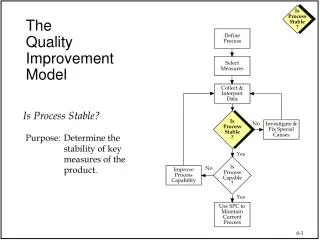
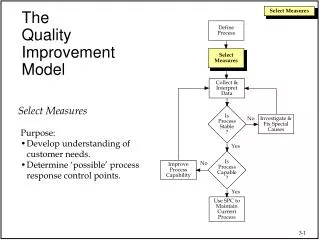
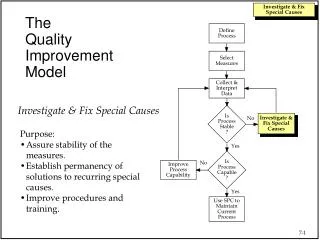
TheQualityImprovementModel Define Process Select Measures Collect & Interpret Data Investigate & Fix Special Causes IsProcessStable? Investigate & Fix Special Causes No • Purpose: • Assure stability of the measures. • Establish permanency of solutions to recurring special causes. • Improve procedures and training. Yes IsProcessCapable? No Improve Process Capability Yes Use SPC to Maintain Current Process
Control Chart UCL Quality Characteristic CL LCL Time Unstable Process How do we improve an unstable process?
Potential Special Causes • Lack of standardization • Lack of consistent process conditions • Uncontrolled process variables • Unknown process variables • Fluctuating business environment • Equipment malfunctions • Unstable measurement process • Changes in process inputs
The Improvement Process Diagnose Solve • Study the Symptoms • Theorize Causes • Establish True Causes • Propose Alternative Solutions • Select & Apply Solution • Maintain Improvements We must take the time to identify the cause before attempting to solve the problem.
Special Cause Action Plan(S.C.A.P.) • A planned sequence of activities for investigating and taking action on a problem which has been detected. • Provides a prioritized listing of potential special causes. • The S.C.A.P. should be updated whenever necessary. Actions 1) Investigation 2) Compensation 3) Documentation 4) Correction 5) Prevention Note: This is the most important part in implementing S.P.C.
Investigative Action Systematic “detective” work to determine the root source of the special cause. The investigative actions should be directed toward determining: • What • When • Why • Where Unless the urgency of special cause dictates other action, investigative action should precede any other actions. Regardless of the urgency, investigative action should always be taken at some point. Note: This is the most important part of the S.C.A.P..
Compensating Action Adjustment made to the process after a nonconformity, defect, or other undesirable process situation in an attempt to restore the process to the desired state, without addressing the underlying cause of the situation. (ISO definition) • Taking action on the process in the form of adjustments to the process. These actions do not remove the cause but are known to adjust the process in a favorable direction. (Adjusting) • OR • Taking action on the process to remove the symptom of the special cause. This may not prevent the same problem from recurring in the future. (Fixing) Adjustments may help one part of the process but could be detrimental to others.
Documentation Recording the suspected cause of the problem, what actions were taken and how effective the action was. Benefits:
Pareto of Causes Frequency of Occurrence Cause D Cause G Cause A Cause B Cause N All others Note: Putting resources to eliminating Cause D will result in most significant Impact on process improvement.
Corrective Action • Actions taken to eliminate the causes of existing nonconformity, defect, or other undesirable situation in order to prevent recurrence (ISO definition). • Permanent removal of the root source of recurring special causes that have been identified. Focus is on preventing major recurring special causes. Implementation results in variability reduction.
Preventive Action • Action taken to eliminate the causes of a potential nonconformity, defect, or other undesirable situation in order to prevent occurrence.(ISO definition) • Permanent removal of the root source of a potential special cause that could affect the process. May involve using learning's from one process on another process where the special cause might also occur.
Control To A Standard • A standard way to perform a task. • A standard range that a key process variable should be within. • Standards should be audited. Note: S.O.P.'s NOT being followed can be a major reason for instabilities on control charts!
Why S.C.A.P.'s? • Control "Charts" will NOT improve the process! • S.C.A.P's IMPROVE the process • Provide a procedure for operations to follow in identifying and removing the special cause symptom. • Promote a standardized approach to investigating and compensating for special causes. • Provide a vehicle for documenting causes found and actions taken to aid in future problem solving.
Remember The C&E Matrix Note: C&E is a good place to start building control strategies. This information will be used to develop a Failure Modes Effect Analysis (FMEA) …
A Tool for Developing SCAP's Failure Modes and Effects Analysis
FMEA Definition • A structured approach to: • Assist in developing SCAP's • identifying the ways in which a product or process can fail • estimating the risk associated with specific causes • prioritizing the actions that should be taken to reduce the risk • evaluating the design validation plan (product) or the current control plan (process) • Primary Directive: Identify ways the product or process can fail and eliminate or reduce the risk of failure
Where Do Risks Come From? Cumulative Risk Potential Safety Hazards Poor Control Plans & SOP’s Unclear Customer Expectations Poor Process Capability Raw Material Variation Vague Workmanship Standards Poorly Developed Specification Limits Machine Reliability Measurement Variation (Online and QC) D. H. Stamatis, FMEA:FMEA from Theory to Practice, Quality Press, 1995
Role of FMEA • Key tool of process team to improve the process in a preemptive manner (before failures occur) • Used to prioritize resources to insure process improvement efforts are beneficial to customer • Used to document completion of projects • Should be a dynamic document, continually reviewed, amended, updated
Purposes of FMEA • Analyzesnew processes • Identifies deficiencies in the process control plan • Establishes the priority of actions • Evaluates the risk of process changes • Identifies potential variables to consider in Exploratory Data Analyses (EDA) and Design of Experiments (DOE) studies • Guides the development of new processes • Helps set the stage for breakthrough
FMEA Inputs and Outputs • Inputs • Process map • C&E matrix • Process history • Process technical procedures • Outputs • List of actions to prevent causes or to detect failure modes • History of actions taken
FMEA Team • Team approach is necessary • Recommended representatives: • Design • Practitioners / Operators / Supervisors • Quality • Reliability • Maintenance • Materials • Testing • Supplier
FMEA Terms • Failure Mode • Effect • Cause • Current Controls • Severity, Occurrence, Detection • Risk Priority Number (RPN) Next, Going to define each of these terms…
FMEA Exercise Failure Mode Input Effects Causes Controls • As we go through the different definitions and terms, complete the form below for your process
Failure Mode - Definition • Failure Mode - the way in which a specific process input fails - if not detected and either corrected or removed, will cause the effect to occur • Can be associated with a defect (in discrete manufacturing) or a process input variable that goes outside of specification • Anything that an operator can see that’s wrong is considered a failure mode • Examples • Incorrect PO number • Sample Size too small • Dropped call (customer service) • Temperature too high • Surface contamination • Paint too thin
Effect - Definition • Effect - impact on customer requirements • Generally external customer focus, but can also include downstream processes • Examples • Incorrect PO number: Accounts receivable traceability errors • Dropped call: Customer dissatisfaction • Temperature too high: Paint cracks • Surface contamination: Poor adhesion • Paint too thin: Poor coverage
Cause - Definition • Cause • Sources of process variation that causes the failure mode to occur • Identification of causes should start with failure modes associated with the highest severity ratings • Examples • Incorrect PO number: Typographical error • Dropped call: Insufficient number of CS representatives • Temperature too high: Thermocouple out of calibration • Surface contamination: Overhead hoist systems • Paint too thin: High solvent content
Current Controls - Definition • Current Controls • Systematized methods/devices in place to prevent or detect failure modes or causes (before causing effects) • Prevention consists of mistake proofing, automated control and set-up verifications • Controls consist of audits, checklists, inspection, laboratory testing, training, SOP’s, preventive maintenance, etc.
Linking Failure Modes to Effects Failure Mode 1 Effect 1 Failure Mode 2 Effect 1 Failure Mode 1 Effect 2 Note that the relationship between the failure mode and the effect is not always 1-to-1
Risk Priority Number (RPN) Effects Causes Controls • The output of an FMEA is the Risk Priority Number • The RPN is a calculated number based on information you provide regarding • the potential failure modes, • the effects, and • the current ability of the process to detect the failures before reaching the customer • It is calculated as the product of three quantitative ratings, each one related to the effects, causes, and controls: RPN = Severity X Occurrence X Detection
Definition of RPN Terms • Severity (of Effect)- importance of effect on customer requirements - could also be concerned with safety and other risks if failure occurs (1=Not Severe, 10=Very Severe) • Occurrence (of Cause)- frequency with which a given cause occurs and creates a failure mode. Can sometimes refer to the frequency of a failure mode (1=Not Likely, 10=Very Likely) • Detection (capability of Current Controls) - ability of current control scheme to detect or prevent: • the causes before creating failure mode • the failure modes before causing effect • 1=Likely to Detect, 10=Not Likely at all to Detect
"Example" Rating Scale Detection is typically assumed to imply action can be taken
Quiz! Take 5 minutes to fill in the results and what action should be taken. Be prepared to discuss results.
FMEA Methodology • Two major approaches: • Starting with Cause & Effect Matrix • Starting with FMEA directly from the Process Map • We will explain the approach using the C&E matrix, though both approaches are very similar • Spreadsheet tools have been prepared to assist you in the preparation of the FMEA
FMEA Methodology - Starting with C&E Matrix • Advantage: The Cause & Effect Matrix assists the team in defining the important issues that the FMEA should address by helping to prioritize important customer requirements • Process inputs that could potentially impact these requirements • Prioritizing the Key Process Inputs according to their impact on the Output variables (We want to focus on Inputs that highly impact a large number of Outputs first • The C&E Matrix also provides quantitative output that can be used in the determination of the specific severity ratings for the next stage of the FMEA process
FMEA - Step by Step 1. For each process input, determine the ways in which the input can go wrong (failure modes) 2. For each failure mode associated with the inputs, determine effects of the failures on the customer Remember the internal customers! 3. Identify potential causes of each failure mode 4. List the Current Controls for each cause or failure mode 5. Create Severity, Occurrence, and Detection rating scales 6. Assign Severity, Occurrence and Detection ratings to each cause 7. Calculate RPN’s for each cause 8. Determine recommended actions to reduce high RPN’s 9. Take appropriate actions and recalculate RPN’s
Process Mapping Examples Manufacturing Outputs Outputs Inputs Types Inputs Types NADM Mixing Water and Metals Preparation Extrude through die Solution Preparation • pH • Temp • Specific Gravity • Clarity • Appearance (Color, Wetness) • Appearance (Color) • Physical Chemical Properties • Cycle Time (plugging) • Zone 3 Temp Nitric Acid C H2O2 C Water C ADM C Hold Time U Agitation C Phos Acid C Nozzle Type C Spray Time C Water C Moly C Nickel C Base C Temperature C Rate C Air Flow C Res Time C Total Rate C Mixer Speed C Al2O3 Qual U Rec Comp U Ext Rate C Die Wear U Ext RPMs C Die Change U Temperature C Rot speed C Draft C Feed Rate C Drying air U • TV of Mix -Quality Check around extrusion • TV of Mix - Quality Check around extrusion • Surface Area • Pore Volume • Appearance Fluid Bed Dryer Final preparation / appearance issues Extrusion Impregnation Metals addition Dryer Calciner Material drying, surface area issues
C&E Matrix Example • This is the C&E Matrix for the previous Manufacturing Process Map with the Key Inputs sorted by the Total Score
FMEA Worksheet Before we move to the example let’s look at an FMEA worksheet The information on this sheet is transferred directly to the FMEA form The purpose of this worksheet is to focus the team on the FMEA inputs and not on scoring The scoring should be done after the basic inputs have been made FMEA Worksheet.XLS
FMEA Step 1 1. For Each Process Input, Determine the Ways in Which the Input Can Go Wrong (Failure Modes) We will first deal with the Moly Flow Rate input variable.
FMEA Step 2 2. For Each Failure Mode Associated with the Inputs, Determine Effects These effects are internal requirements for the next process and/or to the final customer
FMEA Step 3 3. Identify Potential Causes of Each Failure Mode In most cases, there will be more than one Cause for a Failure Mode but we’ll keep it simple for this exercise May elect to list both effects on a single line since they relate to a single cause, and reduce a line in the table.
FMEA Step 4 4. List the Current Controls for Each Cause For each failure mode/cause we list how we are either preventing the cause or detecting the failure mode We will list the procedure number where we have a SOP We need to be considerate of “holes” in the current controls column…..in this example, there are controls on the operation
FMEA Step 5 5. Create Severity, Occurrence, and Detection Rating Scales Example Rating Scale
FMEA Step 6 6. Assign Severity, Occurrence and Detection Ratings to Each Cause • We are now ready to transfer the worksheet input to the FMEA form • Copy and paste the worksheet columns into the appropriate FMEA form columns • The team then starts scoring each row to compute the RPN values • Notes: • You will only use one Severity value • Determine which effect has the highest associated Severity and use that SEV value for ALL causes for the related failure mode (Worst Case) • When combining effects that have the same cause … Next Slide
FMEA Step 6 Continued… If you chose to combine these and put both the Off-Spec Material and Plugs dryer in a single effects block, then the SEV score should be 10. 6. RPN Component Value Assignment
FMEA Step 7 7. Calculate RPNs • Multiply the Severity, Occurrence, and Detection values for each line in the FMEA • The Excel form automatically calculates the RPN for you • Then sort all lines by RPN • Notice that you have to identify all cells so you can carry the failure modes, effects, causes and current controls along with the sort
RPN Review • Once you calculate the RPN for each failure mode / cause / controls combination, review the results and look for insights • Do the gut check - does the Pareto of items make sense? • If not, maybe the ratings given are varying • Determine potential next steps: • Data collection • Experiments • Process improvements • Process control implementations
FMEA Step 8 8. Determine Recommended Actions to Reduce High RPN’s Now fill in recommended actions for top RPNs Actions are recommended for only the high RPN’s The key is FOCUS!