Download
1 / 50
500 likes | 606 Views
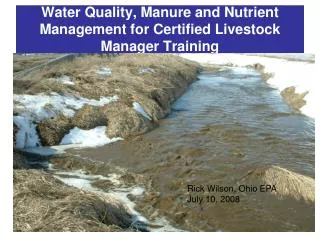
Water Quality impairment and manure management. Ohio EPA February 6, 2007. Mandate to Restore Polluted Waters. FEDERAL WATER POLLUTION CONTROL ACT [As Amended Through P.L. 107–303, November 27, 2002].

E N D
Water Quality impairment and manure management Ohio EPA February 6, 2007
Mandate to Restore Polluted Waters FEDERAL WATER POLLUTION CONTROL ACT [As Amended Through P.L. 107–303, November 27, 2002] SEC. 101. (a) The objective of this Act is to restore and maintain the chemical, physical, and biological integrity of the Nation’s waters.
1222 Habitat Alterations 922.1 847.2 932.7 Siltation 547.4 754.2 783.2 Organic Enrichment 762.7 931.2 575.9 Assessment Nutrients 305.6 Cycle 228 2000 537.3 1998 Flow Alteration 313.3 1996 314.8 413.5 Metals 379 226.1 0 200 400 600 800 1000 1200 1400 Miles Impaired By Cause Leading Causes of Impairment2000 Ohio Water Resources Inventory
What is Nutrient Impairment? • Effects of Nutrients on Aquatic Life Nutrients, except under unusual circumstances, rarely approach concentrations in the ambient environment that are toxic to aquatic life. However, nutrients, while essential to the functioning of healthy aquatic ecosystems, can exert negative effects at much lower concentrations by altering trophic dynamics, increasing algal and macrophyte production (Sharpely et al. 1994), increasing turbidity, decreasing average dissolved oxygen (D.O.) concentrations, and increasing fluctuations in diel D.O. and pH. Such changes are caused by excessive nutrient concentrations resulting in shifts in species composition away from functional assemblages of intolerant species, benthic insectivores and top carnivores typical of high quality warmwater streams towards less desirable assemblages of tolerant species, niche generalists, omnivores, and detritivores typical of degraded warmwater streams.
Habitat Destruction and Nutrient EnrichmentEffects on Stream Fish Community Degraded Fishery Healthy Fishery
Good Habitat(Shading, Better Nutrient Processing, More Living Places)
Poor Habitat(Full Sunlight, Boom and Bust Production, Fewer Living Spaces)
2004 2005 USGS ‘05 2006 Basins Nutrient StudySampling Locations2004 & 2005
9/12–14/05 25 20 D.O. mg/l 15 10 5 0 0 2000 4000 6000 8000 Time Gross Nutrient EnrichmentStillwater River
Buffers and Habitat Quality Bank erosion Nothing here to filter pollution
Managing the Landscape to Manage Nutrient Loads • Streams need wide buffers • provide shading • cooler temperature • limit algae growth • filter pollutants • allow sediment to drop out • vegetation take up nutrients • accidents do happen, need margin of safety • Good Physical Habitat • increase processing of nutrients • where drainage needed, consider natural channel design • Wetlands or Riparian for Tile Drainage • tiles by-pass riparian zone
Little or No Data Background Normal Enriched Polluted Average Phosphorus Concentrations Around Ohio
Stream Quality Very Poor Poor Fair Good Excellent Stream Quality and Density of CAFOs Mercer Auglaize Darke
High Versus Low Flow Measurements of Nutrients(“Associations” report--1999) • The concentration of nutrients lotic (i.e., moving water) ecosystems increases significantly with increased flow. • The assimilation and removal of nutrients by an intact and healthy riparian buffer is significant, although the magnitude varies seasonally. • Evidence of negative short term effects of elevated nutrient concentration on resident aquatic assemblages is lacking. It is the residual effects of nutrient loadings that are likely of most consequence to aquatic community performance.
Ag Stormwater Exemption & BMPs • Regardless of whether a Livestock or poultry facility or individual (i.e., manure applicator) is regulated under Permit (ODA, or OEPA). The provisions of Ohio’s Water Quality Standards (WQS) apply across the board. Where water quality standards are exceeded due manure handling, the Agricultural Storm water exemption is the means by which the responsible individual(s) can avoid potential enforcement of the violation(s) of WQS. • In order to claim Agricultural Stormwater Exemption applies, the responsible party must provide and/or demonstrate that they have followed Best Management Practices. • In general those BMPs are listed in ODA’s Permit to Operate and Ohio EPA’s NPDES permit for CAFOs, and they are listed in NRCS Standard 633 and 590. BMPs include: demonstration that proper rate, timing, method, and form are implemented. Keeping records that demonstrate BMP implementation are a BMP, and so is checking the forecast.
BMPs and the permits that Require them to be implemented. • Setbacks! • Tile Outlet checks! • Evaluate field for Soil Cracks! • Site specific areas of concern (concentrated flow paths) • Agronomic Utilization! (Keep Soil test P levels from skyrocketing) • Forecast! • Record keeping!
Site Specific Nutrient Planning:Recognize where the risks are, and address it through planning. (Beegle webcast)
Know where your land application field drains, and monitor there.
Know where your land application field drains, and monitor there.
Forecast-Kenton OH 6-28-06www.noaa.gov (Hourly Weather Graph)
Sample Record FormBlank Form Provided in packetHard Copy can be mailed anytime upon request from Ohio EPA. I can also forward electronically. http://www.epa.state.oh.us/dsw/cafo/monitor.html
Circa 1922 • “The latest and most efficient method of fixing Nitrogen was invented by a scientist named Haber. In his process hydrogen gas is mixed with Nitrogen (air)and subjected to great pressure. They unite to form Ammonia, which is easily changed into good nitrogen fertilizer.
Circa 1922 cont. • “The machinery used can be driven by steam engines (Editorial remark: and now fossil fuels such as Natural Gas). The Haber invention gives promise of increased fertilizer supply, and therefore and increased food supply to the world.” • So what’s happened since the Haber Invention?
Something to think about. Population of Human Species. Source: U.N.
Lake Erie-Western Basinper research from Heidelberg College (Baker et al) • Despite increased focus on conservation efforts, Phosphorus load is increasing in Lake Erie. • Excessive phosphorus loading identified as cause for increases in Blue-green algae (Microcystis). • Decreases in Phosphorus Load from Sediment noted, but increases in Dissolved reactive Phosphorus, which is 100% available to support algal growth. Photo by: Thomas Bridgeman, University of Toledo
Rain or snow melt Particulate phosphorus associated with eroded soil particles. Dissolved phosphorus picked up from soil solution. Surface Runoff Zone of runoff interaction - 1-5 cm. Infiltration and percolation Tile flow with nitrate How does phosphorus move from fields to streams? Under conservation tillage phosphorus accumulates at the soil surface. From Heidelberg Baker et al.
Detroit River 24.3 km3 water 287 mtons TP 15x more water Maumee River 1.56 km3 water 587 mtons TP 2x more phosphorus Baker et al, 2007
Agricultural Phosphorus and Eutrophication, Second Edition A.N. Sharpley, T. Daniel, T. Sims, J. Lemunyon, R. Stevens, and R. Parry United States Department of Agriculture Agricultural Research Service, ARS–149, September 2003
From Doug Beegle LPES Webcast:http://lpe.unl.edu/pdfs/07janPPbeegle.pdfThe Squeeze
National Water-Quality Assessment Program • Last comment from “Nutrients and Suspended Sediment in Snowmelt Runoff from part of the Upper Mississippi River Basin, Minnesota and Wisconsin, 1997-Fallon and McNellis” report… • “In agricultural and forested streams, the snowmelt period can deliver greater proportions of annual loads of nutrients and suspended sediment than other equivalent periods, and occasionally, the majority of the annual load. Consequently, the snowmelt period should be considered in strategies aimed at reducing loads of nutrients and suspended sediments to streams.”
Injected manure • Soil saturation checked and recorded? • Rate based in consideration of all variables. • Remember manure application in these conditions, leaves is still not considered a good practice. It’s marginal at best with regard to true nutrient utilization.
Evaluate each field for site specific issues (e.g. concentrated flow paths)
Snow water equivalent 02-05-07 • Snow water equivalent is a consideration prior to placement. Recognize that additional show cover can increase the liklihood of losses during thaw event.
Current Soil TemperaturesOARDC Weather Stationshttp://www.oardc.ohio-state.edu/centernet/weather.htm • Hoytville (Northwest Ohio) at noon Friday 02-02-07: • 2”= 32.17 degrees F • 4” = 29.78 degrees F • Hoytville (Northwest Ohio) at 8:00 a.m. Monday 02-05-07: • 2” = 23.96 degrees F • 4” = 26.70 degrees F • Wooster at 8:00 a.m. Monday 02-05-07: • 2” = 26.13 degrees F • 4” = 31.60 degrees F
For Questions or More Info Call: cathy.alexander@epa.state.oh.us (614) 644-2021 rick.wilson@epa.state.oh.us (614) 644-2032 melinda.harris@epa.state.oh.us (614) 728-1357 • Information on Ohio EPA Water Quality Information:http://www.epa.state.oh.us/dsw/index.html