Download
1 / 15
150 likes | 160 Views
This article discusses the sources and mechanisms of groundwater flooding, possible approaches to mapping, and potential barriers. It highlights the need for improved data collection and coordination for better mapping.

E N D
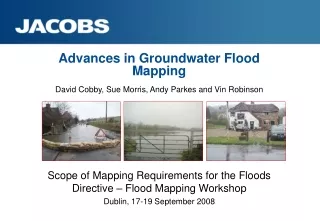
Advances in Groundwater Flood MappingDavid Cobby, Sue Morris, Andy Parkes and Vin Robinson Scope of Mapping Requirements for the Floods Directive – Flood Mapping Workshop Dublin, 17-19 September 2008
Sources of groundwater flooding and the need for mapping Possible approaches to mapping Possible barriers to better mapping The need for data Summary Presentation Outline
Sources of Groundwater Flooding • In UK and Ireland, hazard in recent past appears to be predominantly in England • Three most significant sources are the rise of groundwater levels in: • unconfined Chalk to exceptionally high levels in response to prolonged extreme rainfall; • permeable superficial aquifers in hydraulic continuity with high in-bank river levels or extreme tidal conditions; and • in response to reduced groundwater abstraction in an urban area (or a mining area).
Chalk Flooding Mechanism • Characteristics: • relatively slow rise • duration can be weeks or even months • may happen infrequently • Environment Agency offer an informal information service
Permeable Superficials Flooding Mechanism • Characteristics: • relatively rapid rise • duration commensurate with fluvial/coastal flooding • may happen more frequently than fluvial/coastal flooding • may occur in locations protected by existing defences Groundwater flooding River Thames
Groundwater Rebound Mechanism • Characteristics: • aquifer response can take decades • could impact large areas with significant infrastructure • rebound to natural levels could be permanent • further abstraction to control levels could depend on quality/usefulness of the water Figures courtesy of www.groundwateruk.org
Locations to Consider Consolidated aquifers (i.e. Chalk) Permeable superficial aquifers Conurbations with rising groundwater
Possible Approaches to Mapping: PFRA • Preliminary Flood Risk Assessments: • appropriate scale: regional • based on existing or readily derivable information • descriptions of previous flood events • general response of different aquifers to the drivers (e.g. rainfall) • Base Flow Index (BFI) of rivers
Possible Approaches to Mapping: Article 6 • Hazard and risk maps: • low probability or extreme event scenarios • prepared for potential high risk areas, i.e. • unconfined Chalk; • permeable superficial aquifers in hydraulic continuity with major rivers; and • major conurbations where groundwater is rebounding. • Difficulties will include determination of water depth and probabilities
Possible Approaches to Mapping: Article 6 • Unconfined Chalk • define a ‘baseline’ groundwater level surface • subtract from ground surface to give depth to groundwater • raise baseline surface until outline of groundwater emergence at surface contains locations known to have flooded • Indicates areas where groundwater could be near to ground surface under similar hydrological conditions to observations
Possible Approaches to Mapping: Article 6 • Permeable superficial deposits • identify bankfull elevations • extrapolate these outwards across the permeable superficial deposits in the floodplain • subtract ground elevations from bankfull elevations • Indicates areas which could be flooded by groundwater before the river rises out of bank
Possible Approaches to Mapping: Article 6 • Rebound under major conurbations • identify natural groundwater level • observe and/or model reduction in groundwater drawdown • compare with ground surface and/or underground infrastructure • Indicates areas which could be inundated by rising groundwater Taken from JBA (2006) Flooding from Other Sources
Possible Barriers to Mapping: Article 6 • Difficulty in assigning probabilities to occurrences of Chalk groundwater flooding due to system ‘memory’ and bounding of levels at the ground surface • Possible approaches include • assess the frequency of observed flooding; • assess the frequency from the drivers (e.g. rainfall); • assess the frequency from surrogates (e.g. groundwater levels); • assess the frequency from a combination of drivers and surrogates; and • mathematical modelling.
The Need for Data • Data collection and collation has been incomplete and uncoordinated • For improved mapping, required data include: • observations of groundwater flooding; • monitoring and contours of high groundwater levels; • higher resolution geological data; and • estimates of natural groundwater levels.
Summary • Groundwater flooding is now recognised as a potentially serious form of flooding • Most hazardous areas are likely to be • unconfined Chalk; • permeable superficial aquifers in hydraulic continuity with major rivers; and • major conurbations where groundwater is rebounding. • Success achieved in regional scale mapping, particularly in unconfined Chalk • Improved mapping requires • further research into assigning probabilities • coordinated collection and collation of data