Download
1 / 10
100 likes | 311 Views
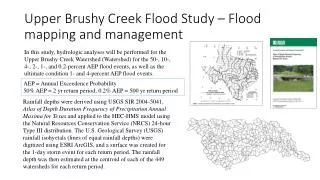
Upper Brushy Creek Flood Study – Flood mapping and management. In this study, hydrologic analyses will be performed for the Upper Brushy Creek Watershed (Watershed) for the 50-, 10-, 4-, 2-, 1-, and 0.2-percent AEP flood events, as well as the ultimate condition 1- and 4-percent AEP flood events.

E N D
Upper Brushy Creek Flood Study – Flood mapping and management In this study, hydrologic analyses will be performed for the Upper Brushy Creek Watershed (Watershed) for the 50-, 10-, 4-, 2-, 1-, and 0.2-percent AEP flood events, as well as the ultimate condition 1- and 4-percent AEP flood events. AEP = Annual Exceedence Probability 50% AEP = 2 yr return period; 0.2% AEP = 500 yr return period Rainfall depths were derived using USGS SIR 2004-5041, Atlas of Depth Duration Frequency of Precipitation Annual Maxima for Texas and applied to the HEC-HMS model using the Natural Resources Conservation Service (NRCS) 24-hour Type III distribution. The U.S. Geological Survey (USGS) rainfall isohyetals (lines of equal rainfall depths) were digitized using ESRI ArcGIS, and a surface was created for the 1-day storm event for each return period. The rainfall depth was then estimated at the centroid of each of the 449 watersheds for each return period.
Areal Reduction For watersheds with contributing areas greater than 10 square miles, precipitation was reduced per guidance provided in Technical Paper No. 40, Rainfall Frequency Atlas of the United States, (USDC, 1961).
Infiltration and Loss The NRCS Curve Number method was used to estimate runoff loss in the Watershed. Precalibrationmodel setup was made using an assumption of Antecedent Runoff Condition (ARC) II. Existing Condition Curve numbers were developed for the undeveloped land use based on the major land use types identified by Technical Advisory Committee (TAC) (Table 1). For rural areas, the portion of each watershed that was not impervious was estimated to have the same rainfall loss characteristics as the land use descriptions derived from TAC shown in Table 1.
Impervious Cover Development was accounted for by applying a percent impervious cover value to the above curve numbers. Watershed-wide, a Geographical Information Systems (GIS) layer was developed (on a 1-meter pixel level) of impervious surface from available multispectral imagery (TNRIS, 2010). Percent impervious and curve number for each watershed were then estimated directly from this layer. For urban areas, the portion of each watershed that is not impervious was estimated to have the same rainfall loss characteristics as pasture/grass in good condition. Ultimate Condition For the ultimate condition, future percent impervious values were estimated based on information provided by each city.
Soils and Losses Soils Hydrologic soil groups were determined for each drainage area using the soil series for Williamson County available from the Soil Survey Geographic Database (SSURGO). A key code was available from SSURGO correlating soil type to a hydrologic soil group (A, B, C, D, or Water/Quarry, in increasing imperviousness). Initial Abstraction The model default value of initial abstraction (Ia = 0.2S) was used in the study's HEC-HMS model. Calibration results indicate that it is a reasonable model for initial abstraction throughout the watershed. Model Timestep – a timestep of 10 minutes was used in modeling. Model Run Duration – a 48-hour runtime was utilized.
Probable Maximum Flood at Dam 7 Evaluating the PMF event requires determining probable maximum precipitation (PMP) depths for TCEQ rainfall durations (1‐, 2‐, 3‐, 6‐, 12‐, 24‐, 48‐, and 72‐hour). Due to the basin size, all 8 of the TCEQ storm durations were analyzed. The duration that produces the maximum water surface elevation in the reservoir then becomes the critical duration and is used as the PMF. Rainfall depths were developed using HMR-52 and temporal distributions following TCEQ Guidelines. The frequency model has 35 basins upstream of Dam 7, and the PMP varies slightly for each basin. The average PMP depth of the 35 basins for the various duration events is shown in the table. Dam 7 PMF Information provided by: http://www.tceq.texas.gov/publications/gi/gi-364.html
PMP Orientation The orientation of the PMP is adjusted for the drainage basins. HMR52 provides a “preferred orientation” based on the geographic location and then adjusts the orientation further based on the actual drainage basins. For example, the Dam 7 area has a preferred orientation of 210 degrees, but for the analysis, the orientation was adjusted to 260.
Probable Maximum Flood at Dam 7 For the Dam 7 analysis, the critical event is created by the 12-hour duration as it results in the highest water surface elevation (as shown in the table), thereby making it the PMF event. The average rainfall depth is 35.5 inches for this duration. As precipitation duration increases, volume of water increases but average intensity diminishes.
TCEQ PMP Hyetograph Distribute the total depth of the PMP temporally. The development of the temporal distributions is based on observed evidence that near-PMP values for significantly different durations have not occurred in the same event. In other words, though previous methods assumed the PMP value for the peak one-hour event occurred within the same event as the peak PMP value for 24 hours and also for 72 hours, such storms have never actually been observed. Historical data has also shown that the most extreme near-PMP events tend to be front loaded, with most of the rainfall occurring early in the event. 6-hour design storm for Dam 7 P T