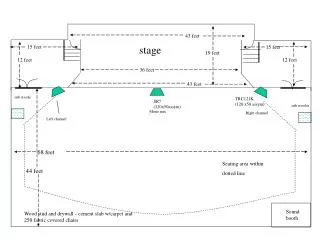
Stage
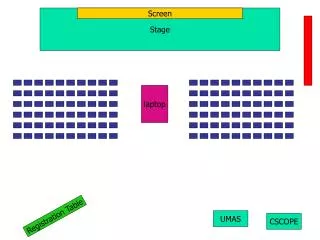
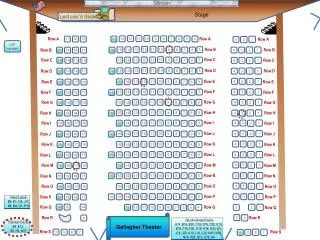
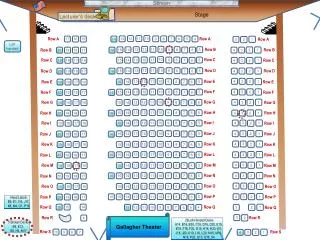
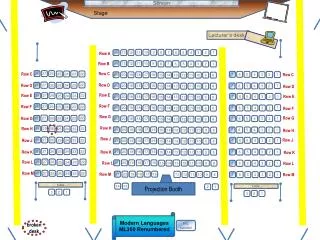
Stage. Screen. Lecturer’s desk. 11. 10. 9. 8. 7. 6. 5. 2. 14. 13. 12. 4. 3. 1. Row A. 14. 13. 12. 11. 10. 9. 6. 8. 7. 5. 4. 3. 2. 1. Row B. 28. 27. 26. 23. 25. 24. 22. Row C. 7. 6. 5. Row C. 2. 4. 3. 1. 21. 20. 19. 18. 17. 16. 13. Row C. 15.

Stage
E N D
Presentation Transcript
Stage Screen Lecturer’s desk 11 10 9 8 7 6 5 2 14 13 12 4 3 1 Row A 14 13 12 11 10 9 6 8 7 5 4 3 2 1 Row B 28 27 26 23 25 24 22 Row C 7 6 5 Row C 2 4 3 1 21 20 19 18 17 16 13 Row C 15 14 12 11 10 9 8 22 27 28 26 25 24 23 Row D 1 Row D 6 21 20 19 18 17 16 13 7 5 4 3 2 15 14 12 11 10 9 8 Row D Row E 28 27 26 22 Row E 23 25 24 7 6 5 1 2 4 3 Row E 21 20 19 18 17 16 13 15 14 12 11 10 9 8 Row F 28 27 26 23 25 24 22 Row F 1 6 21 20 19 18 17 16 13 7 5 4 3 2 15 14 12 11 10 9 8 Row F Row G 22 27 28 26 25 24 23 7 6 5 1 Row G 2 4 3 Row G 21 20 19 18 17 16 13 15 14 12 11 10 9 8 Row H 28 27 26 22 23 25 24 Row H 6 21 20 19 18 17 16 13 7 5 4 3 2 1 15 14 12 11 10 9 8 Row H Row J 28 27 26 23 25 24 22 7 6 5 Row J 2 4 3 1 Row J 21 20 19 18 17 16 13 15 14 12 11 10 9 8 22 27 28 26 25 24 23 6 21 20 19 18 17 16 13 7 5 4 3 2 1 15 14 12 11 10 9 8 Row K Row K Row K 28 27 26 22 23 Row L 25 24 21 20 19 18 17 16 13 6 15 14 12 11 10 9 8 Row L 7 5 4 3 2 1 Row L 28 27 26 22 23 Row M 25 24 21 20 19 18 17 16 13 6 12 11 10 9 8 Row M 7 5 4 3 2 1 Row M table • Projection Booth 14 13 2 1 table 3 2 1 3 2 1 Modern Languages ML350 Renumbered R/L handed broken desk
Status of Null Hypothesis(actually, via magic truth-line) True Ho False Ho Do notReject Ho Decision madeby experimenter Reject Ho Homework Worksheet Type I versus Type II Error You are wrong! Type II error(miss) You are right! Correct decision You are wrong! Type I error(false alarm) You are right! Correct decision • Probability of rejecting a true null hypothesis = alpha • The alpha you choose becomes the probability of • making a Type I error
Please click in My last name starts with a letter somewhere between A. A – D B. E – L C. M – R D. S – Z
MGMT 276: Statistical Inference in ManagementRoom 350 Modern LanguagesSpring, 2012 Welcome Ella Fitzgerald sings “Tea for Two”
Exam 2 – Tuesday (3/20/12) Study guide online soon Bring 2 calculators (remember only simple calculators,we can’t use calculators with programming functions) Bring 2 pencils (with good erasers) Bring ID
Exam 2 March 20th Please read: Chapters 5 - 11 in Lind book & Chapters 10, 11, 12 & 14 in Plous book: Lind Chapter 5: Survey of Probability Concepts Chapter 6: Discrete Probability Distributions Chapter 7: Continuous Probability Distributions Chapter 8: Sampling Methods and CLT Chapter 9: Estimation and Confidence Interval Chapter 10: One sample Tests of Hypothesis Chapter 11: Two sample Tests of Hypothesis Plous Chapter 10: The Representativeness Heuristic Chapter 11: The Availability Heuristic Chapter 12: Probability and Risk Chapter 14: The Perception of Randomness
Use this as your study guide By the end of lecture today3/6/12 Connecting intentions of studies with Experimental Methodologies Appropriate statistical analyses Appropriate graphs The Seven Prototypical Designs Steps for hypothesis testing One-tailed versus Two-tailed test Logic (and example) of hypothesis testing using z scores
Homework due - (March 8th) On class website: please print and complete homework worksheet #11 Please double check – Allcell phones other electronic devices are turned off and stowed away
Create example of each type Identify IV (one or two) Identify DV (one or two) Draw possible graph for each Think about how you might Think about this as we work through each type of study Study Type 1: Confidence Intervals Study Type 2: t-test Study Type 3: One-way Analysis of Variance (ANOVA) Study Type 4: Two-way Analysis of Variance (ANOVA) Study Type 5: Correlation Study Type 6: Simple and Multiple regression We’ll come back to these distinctions over and over again, and build on them for the rest of the class. Let’s get this overview well! Not worry about calculation details for now Study Type 7: Chi Square
Study Type 1: Confidence Intervals Comparing two means Study Type 2: t-test Study Type 3: One-way Analysis of Variance (ANOVA) Comparing more than two means
Study Type 1: Confidence Intervals Study Type 2: t-test Study Type 3: One-way Analysis of Variance (ANOVA) Study Type 4: Two-way Analysis of Variance (ANOVA) Comparing two independent variables Each one has multiple levels
“Two-way” = “Two IVs” Study Type 4: Two-way ANOVA Ian was interested in the effect of incentives (and age) for girl scouts on the number of cookies sold. He randomly assigned girl scouts into one of three groups. The three groups were given one of three incentives and he looked to see who sold more cookies. The 3 incentives were: 1) Trip to Hawaii, 2) New Bike or 3) Nothing. He also measured the scouts’ ages. Independent Variable #1 Independent Variable #2 Dependent Variable
Study Type 4: Two-way ANOVA Multiple Independent Variables (categorical), each variable comparing two or moregroups Single Dependent Variable (numerical/continuous) Used to test the effect of two IV on the DV Independent Variable #1: Type of incentive Levels of Independent Variable: None, Bike, Trip to Hawaii Independent Variable #2: Age Levels of Independent Variable: Elementary girls versus college Dependent Variable: Number of cookies sold Levels of Dependent Variable: 1, 2, 3 up to max sold Between participant design Results: Incentive had an effect – it increased sales Data suggest age had an effect – older girls sold more
Study Type 4: Two-way ANOVA Two Independent Variables (categorical) Single Dependent Variable (numerical/continuous) Used to test the effect of two IV on the DV Dependent variable is always quantitative College College Elementary Sales Elementary Sales New Bike None Trip Hawaii New Bike None Trip Hawaii In an ANOVA, both independent variables are qualitative (with more than two groups)
Study Type 1: Confidence Intervals Study Type 2: t-test Study Type 3: One-way Analysis of Variance (ANOVA) Study Type 4: Two-way Analysis of Variance (ANOVA) Study Type 5: Correlation
Pretty much all correlations are “quasi-experimental” Study Type 5: Correlation plots relationship between two continuous / quantitative variables Neutral relative to causality – but especially useful for predictions Relationship between amount of money spent on advertising and amount of money made in sales Dependent variable is always quantitative Dollars spent on Advertising Positive Correlation In correlation, both variables are quantitative Dollars in Sales Describe strength and direction of correlation – in this case positive/strong Graphing correlations use scatterplots (not bar graphs)
Study Type 1: Confidence Intervals Study Type 2: t-test Study Type 3: One-way Analysis of Variance (ANOVA) Study Type 4: Two-way Analysis of Variance (ANOVA) Study Type 5: Correlation Study Type 6: Simple and Multiple regression
YearlyIncome Expenses per year Study Type 6: Regression: Using the correlation to predict the value of one variable based on its relationship with the other variable Multiple regression will use multiple independent variables to predict the dependent variable You probably make this much The predicted variable goes on the “Y” axis and is called the dependent variable. The predictor variable goes on the “X” axis and is called the independent variable You probably make this much Dependent Variable (Predicted) If you spend this much If you save this much Independent Variable 1 (Predictor) If you spend this much Independent Variable 2 (Predictor)
Study Type 1: Confidence Intervals Study Type 2: t-test Study Type 3: One-way Analysis of Variance (ANOVA) Study Type 4: Two-way Analysis of Variance (ANOVA) Study Type 5: Correlation Study Type 6: Simple and Multiple regression Study Type 7: Chi Square
Study Type 7: Chi square is used to evaluate nominal data (just count how many in each category) or objects or events Variables are nominal or ordinal (so we comparing frequencies, not means) What is most popular ride at Disneyland? Just count how many people ride each one. a. Dumbob. Peter Panc. Space Mountaind. Splash Mountaine. Small World We could gather this data using clickers
Why do we concern ourselves about research in business? – Five objectives 1. To explore potential phenomena • explore whether phenomenon is present • explore a phenomenon with a fresh take • generate new ideas and discover relationships
Why do we concern ourselves about research in business? – Five objectives 2. To describe phenomena • build a vocabulary of constructs and make distinctions between similar constructs • cluster similar characteristics into related constructs . - Business strategies e.g. business socks – how might you market this? - Types of management style - Strategies for quality control
Why do we concern ourselves about research in business? – Five objectives 3. To explain and model phenomena • explanation: find cause and effect relationships • propose mechanisms that determine outcomes • show how and why a phenomenon operates as it does
Why do we concern ourselves about research in business? – Five objectives 4. To predict future behavior • what characteristics are likely to result in workerproductivity, consumer behavior, etc... • explanations can help with predictions, but being able to predict an outcome doesn’t necessarily provide a good explanation
Why do we concern ourselves about research in business? – Five objectives 5. To influence behavior • how can we use what we know about human behavior to affect how people around us react and behave (and do what we want) • increasing probability of sales • supervisors increasing probability of happy employees • parent increasing probability of child taking out the trash • to advance better practices
Revisit Hypothesis Testing . notnull null big z score x x • If the observed z falls beyond the critical z in the distribution (curve): • then it is so rare, we conclude it must be from some other distribution • then we reject the null hypothesis • then we have support for our alternative hypothesis Alternative Hypothesis • If the observed z falls within the critical z in the distribution (curve): • then we know it is a common score and is likely to be part of this distribution, • we conclude it must be from this distribution • then we do not reject the null hypothesis • then we do not have support for our alternative . null x x small z score
Rejecting the null hypothesis • The result is “statistically significant” if: • the observed statistic is larger than the critical statistic (which can be a ‘z” or “t” or “r” or “F” or x2) • observed stat > critical stat If we want to reject the null, we want our t (or z or r or F or x2) to be big!! • the p value is less than 0.05 (which is our alpha) • p < 0.05 If we want to reject the null, we want our “p” to be small!! • we reject the null hypothesis • then we have support for our alternative hypothesis
Confidence Interval of 95%Has and alpha of 5%α = .05 Critical z 2.58 Critical z -2.58 Confidence Interval of 99% Has and alpha of 1% α = .01 99% Area in the tails is called alpha Critical z 1.96 Critical z -1.96 95% Critical Z separates rare from common scores 90% Critical z 1.64 Critical z -1.64 Confidence Interval of 90% Has and alpha of 10% α = . 10
One versus two tail test of significance:Comparing different critical scores(but same alpha level – e.g. alpha = 5%) One versus two tailed test of significance 95% 95% 2.5% 5% 2.5% How would the critical z change? Pros and cons…
One versus two tail test of significance5% versus 1% alpha levels How would the critical z change? 2.5% .5% 5% 2.5% 1% .5% -1.64 or +1.64 -1.96 or +1.96 -2.33 or +2.33 -2.58 or +2.58
One versus two tail test of significance5% versus 1% alpha levels What if our observed z = 2.0? How would the critical z change? -1.64 or +1.64 -1.96 or +1.96 Remember, reject the null if the observed z is bigger than the critical z Reject the null Reject the null -2.33 or +2.33 -2.58 or +2.58 Do notReject the null Do notReject the null
One versus two tail test of significance5% versus 1% alpha levels What if our observed z = 1.75? How would the critical z change? -1.64 or +1.64 -1.96 or +1.96 Do not Reject the null Remember, reject the null if the observed z is bigger than the critical z Reject the null -2.33 or +2.33 -2.58 or +2.58 Do notReject the null Do notReject the null
One versus two tail test of significance5% versus 1% alpha levels What if our observed z = 2.45? How would the critical z change? -1.64 or +1.64 -1.96 or +1.96 Remember, reject the null if the observed z is bigger than the critical z Reject the null Reject the null -2.33 or +2.33 -2.58 or +2.58 Do notReject the null Reject the null
√ Ho: µ = 16 Null: No change in the machine Ha: µ ≠ 16 Alternative : Yes change in the machine Two tailed test (α = .05) 1.96 0.15 = .0212 16.017 – 16.0 50 = .8015 .0212 Because theobserved z (.8 ) is smaller than critical z (1.96) .8015 These three will always match -1.96 1.96 No Probability of Type I error is always equal to alpha No No .05
Remember if observed z (or t) is less than one it is impossible to reject the null hypothesis(with alpha of .05) 1.64 No Because observed z (.8 ) is still smaller than critical z (1.64) 2.58 No Because observed z (.8 ) is still smaller than critical z (2.58) there is no change there is a change in mach there is there is no change 1.96 2.58
Thank you! See you next time!!