Download
1 / 51
510 likes | 533 Views
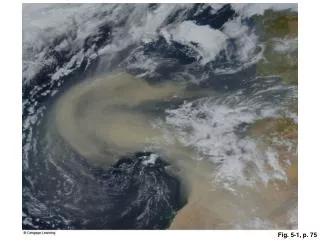
Explore the alarming decrease in biodiversity due to extinction, examining causes like habitat loss, pollution, overfishing, and climate change. Learn about key endangered species, impact on ecosystems, and strategies for conservation.

E N D
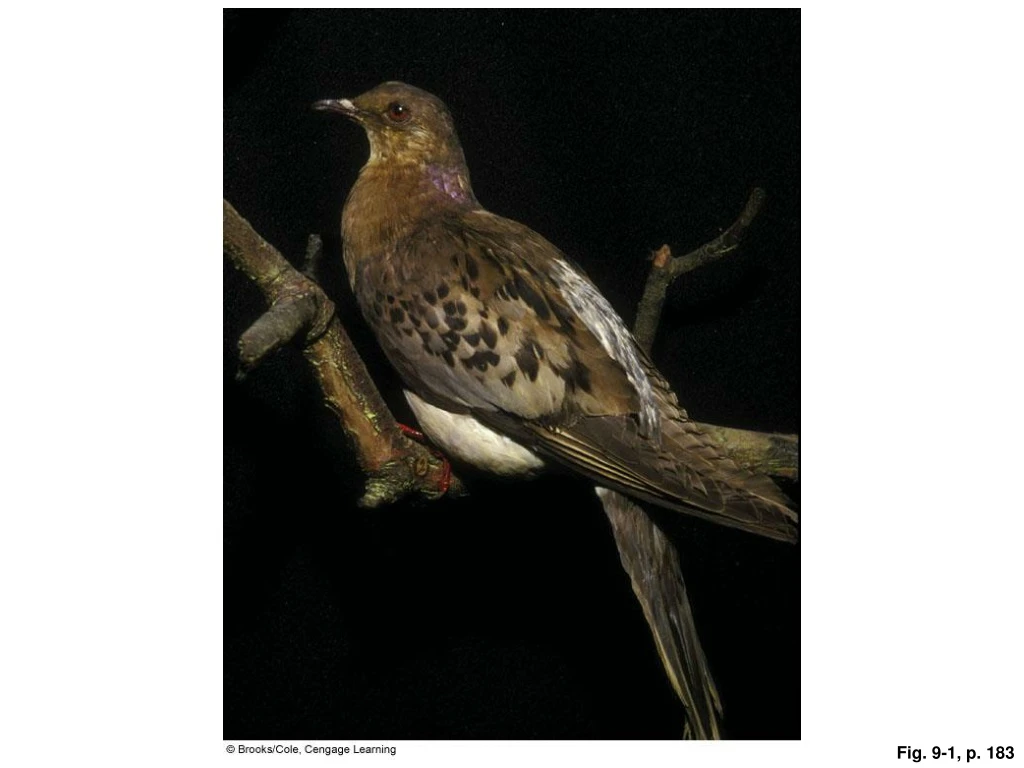
Passenger pigeon Great auk Dodo Golden toad Aepyornis (Madagascar) Fig. 9-2, p. 185
Number of species existing Effects of a 0.1% extinction rate 5 million 5,000 extinct per year 14 million 14,000 extinct per year 50 million 50,000 extinct per year 100,000 extinct per year 100 million 50 100 150 200 0 Number of years until one million species are extinct Fig. 9-3, p. 186
African elephant Kirkland’s warbler Knowlton cactus Florida manatee Grizzly bear Siberian tiger Utah prairie dog Golden lion tamarin Humpback chub Swallowtail butterfly Northern spotted owl Giant panda Whooping crane Black-footed ferret Blue whale Mountain gorilla Florida panther California condor Black rhinoceros Hawksbill sea turtle Fig. 9-4, p. 187
Characteristic Examples Low reproductive rate (K-strategist) Blue whale, giant panda, rhinoceros Blue whale, giant panda, Everglades kite Specialized niche Elephant seal, desert pupfish Narrow distribution Bengal tiger, bald eagle, grizzly bear Feeds at high trophic level Fixed migratory patterns Blue whale, whooping crane, sea turtle African violet, some orchids Rare Snow leopard, tiger, elephant, rhinoceros, rare plants and birds Commercially valuable California condor, grizzly bear, Florida panther Large territories Fig. 9-5, p. 188
Characteristic Examples Low reproductive rate (K-strategist) Blue whale, giant panda, rhinoceros Blue whale, giant panda, Everglades kite Specialized niche Elephant seal, desert pupfish Narrow distribution Bengal tiger, bald eagle, grizzly bear Feeds at high trophic level Fixed migratory patterns Blue whale, whooping crane, sea turtle African violet, some orchids Rare Snow leopard, tiger, elephant, rhinoceros, rare plants and birds Commercially valuable California condor, grizzly bear, Florida panther Large territories Stepped Art Fig. 9-5, p. 188
Fishes 34% (51% of freshwater species) Amphibians 32% Mammals 25% 20% Reptiles 14% Plants Birds 12% Fig. 9-6, p. 189
Rosy periwinkle Cathranthus roseus, Madagascar Hodgkin's disease, lymphocytic leukemia Pacific yew Taxus brevifolia, Pacific Northwest Ovarian cancer Rauvolfia Rauvolfia sepentina, Southeast Asia Anxiety, high blood pressure Neem tree Azadirachta indica, India Treatment of many diseases, insecticide, spermicide Foxglove Digitalis purpurea, Europe Digitalis for heart failure Cinchona Cinchona ledogeriana, South America Quinine for malaria treatment Fig. 9-8, p. 190
NATURAL CAPITAL DEGRADATION Causes of Depletion and Premature Extinction of Wild Species Underlying Causes • Population growth • Rising resource use • Undervaluing natural capital • Poverty Direct Causes • Habitat loss • Pollution • Commercial hunting and poaching • Habitat degradation and fragmentation • Climate change • Sale of exotic pets and decorative plants • Overfishing • Introduction of nonnative species • Predator and pest control Fig. 9-10, p. 193
Indian Tiger Range 100 years ago Range today Fig. 9-11a, p. 194
Black Rhino Range in 1700 Range today Fig. 9-11b, p. 194
African Elephant Probable range 1600 Range today Fig. 9-11c, p. 194
Asian or Indian Elephant Former range Range today Fig. 9-11d, p. 194
Indian Tiger Black Rhino Range 100 years ago Range in 1700 Range today Range today African Elephant Asian or Indian Elephant Former range Probable range 1600 Range today Range today Stepped Art Fig. 9-11, p. 194
Number of bird species 609 400 200 1 Fig. 9-12, p. 195
Black-capped vireo Golden-cheeked warbler Cerulean warbler Sprague’s pipit Bichnell’s thrush Florida scrub jay California gnatcatcher Kirtland's warbler Henslow's sparrow Bachman's warbler Fig. 9-13, p. 196
Deliberately Introduced Species Purple loosestrife European starling African honeybee (“Killer bee”) Nutria Salt cedar (Tamarisk) Hydrilla Marine toad (Giant toad) Water hyacinth Japanese beetle European wild boar (Feral pig) Fig. 9-14a, p. 199
Accidentally Introduced Species Sea lamprey (attached to lake trout) Argentina fire ant Common pigeon (Rock dove) Brown tree snake Eurasian ruffe Formosan termite Zebra mussel Asian long-horned beetle Asian tiger mosquito Gypsy moth larvae Fig. 9-14b, p. 199
Deliberately introduced species Purple loosestrife European starling African honeybee (“Killer bee”) Nutria Salt cedar (Tamarisk) Hydrilla Marine toad (Giant toad) Water hyacinth Japanese beetle European wild boar (Feral pig) Accidentally introduced species Sea lamprey (attached to lake trout) Argentina fire ant Common pigeon (Rock dove) Brown tree snake Eurasian ruffe Formosan termite Zebra mussel Asian long-horned beetle Asian tiger mosquito Gypsy moth larvae Stepped Art Fig. 9-14, p. 199
DDT in fish-eating birds (ospreys) 25 ppm DDT in large fish (needle fish) 2 ppm DDT in small fish (minnows) 0.5 ppm DDT in zooplankton 0.04 ppm DDT in water 0.000003 ppm, or 3 ppt Fig. 9-19, p. 202
DDT in fish-eating birds (ospreys) 25 ppm DDT in large fish (needle fish) 2 ppm DDT in small fish (minnows) 0.5 ppm DDT in zooplankton 0.04 ppm DDT in water 0.000003 ppm, or 3 ppt Stepped Art Fig. 9-19, p. 202