Download
1 / 6
Visual Representations and Data Analysis from Figures and Table in Chapter 11
60 likes | 187 Views
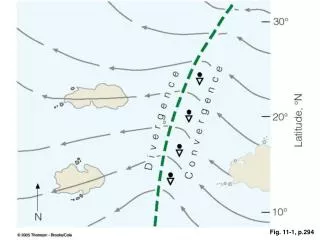
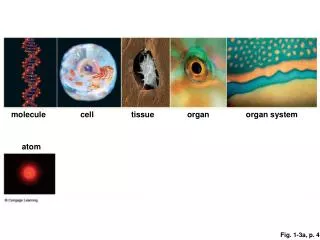
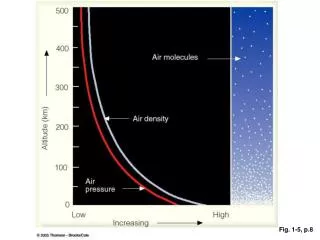
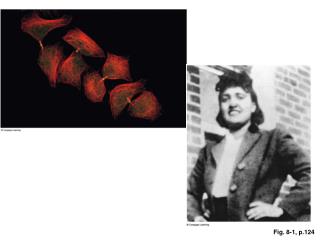
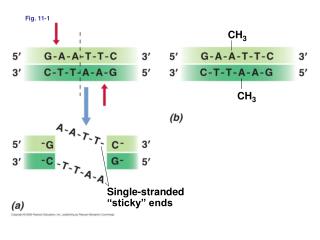
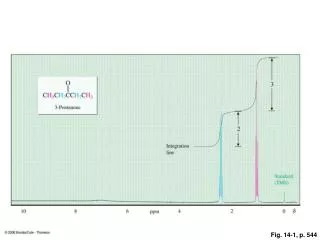
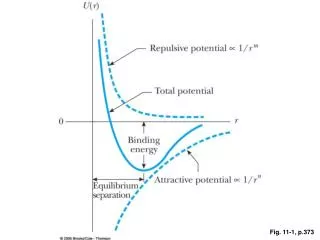
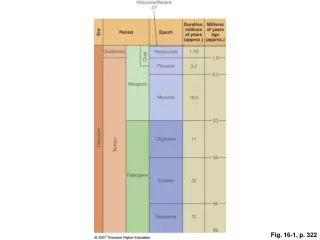
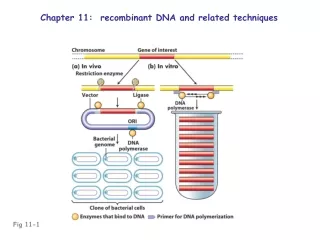
This document summarizes key figures and tables from Chapter 11, including detailed visual analysis of Figures 11-1, 11-3, 11-6b, 11-8, and 11-17, alongside Table 11-2. These visuals illustrate important concepts related to the chapter's themes, providing clarity on complex data sets and trends. Each figure serves to enhance the reader's understanding and retention of the content, while the table offers a concise presentation of pertinent data. By reviewing these elements, readers will better comprehend the integral ideas discussed in the chapter.
Download Presentation 
Visual Representations and Data Analysis from Figures and Table in Chapter 11
An Image/Link below is provided (as is) to download presentation
Download Policy: Content on the Website is provided to you AS IS for your information and personal use and may not be sold / licensed / shared on other websites without getting consent from its author.
Content is provided to you AS IS for your information and personal use only.
Download presentation by click this link.
While downloading, if for some reason you are not able to download a presentation, the publisher may have deleted the file from their server.
During download, if you can't get a presentation, the file might be deleted by the publisher.
E N D


More Related