Download
1 / 54
540 likes | 632 Views
Explore the evolution of student aid and loans for undergraduate and graduate students from 2002 to 2013. Analyze funding sources, average aid, distribution, debt levels, and repayment data. Data obtained from The College Board.

E N D
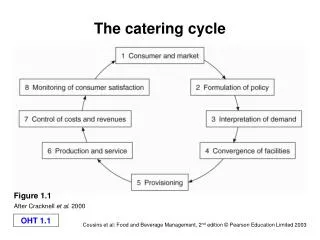
Total Student Aid and Nonfederal Loans Used to Finance Postsecondary Education Expenses in 2012 Dollars (in Millions), 2002-03 to 2012-13 SOURCE: The College Board, trends.collegeboard.org, Table 1. .
Ten-Year Trend in Student Aid and Nonfederal Loans per Full-Time Equivalent (FTE) Student Used to Finance Postsecondary Education Expenses in 2012 Dollars, 2002-03 to 2012-13 SOURCE: The College Board, Trends in Student Aid 2013, Figure 1.
Undergraduate Student Aid by Source and Type (in Billions), 2012-13 SOURCE: The College Board, Trends in Student Aid 2013, Figure 2A.
Total Undergraduate Student Aid in 2012 Dollars (in Millions), 1992-93 to 2012-13, Selected Years SOURCE: The College Board, trends.collegeboard.org, Table 1A.
Graduate Student Aid by Source and Type (in Billions), 2012-13 SOURCE: The College Board, Trends in Student Aid 2013, Figure 2B.
Total Graduate Student Aid in 2012 Dollars (in Millions), 1992-93 to 2012-13, Selected Years SOURCE: The College Board, trends.collegeboard.org, Table 1B.
Average Aid per Full-Time Equivalent (FTE) Undergraduate Student in 2012 Dollars, 1997-98 to 2012-13 SOURCE: The College Board, Trends in Student Aid 2013, Figure 3A.
Average Aid per Full-Time Equivalent (FTE) Graduate Student in 2012 Dollars, 1997-98 to 2012-13 SOURCE: The College Board, Trends in Student Aid 2013, Figure 3B.
Grants and Loans as a Percentage of Funds from Total Aid and Nonfederal Loans for Undergraduate Students, 1992-93 to 2012-13 SOURCE: The College Board, Trends in Student Aid 2013, Figure 4A.
Grants and Loans as a Percentage of Funds from Total Aid and Nonfederal Loans for Graduate Students, 1992-93 to 2012-13 SOURCE: The College Board, Trends in Student Aid 2013, Figure 4B.
Growth of Federal, Institutional, Private and Employer, and State Grant Dollars in 2012 Dollars, 1992-93 to 2012-13 SOURCE: The College Board, Trends in Student Aid 2013, Figure 5.
Growth of Federal and Nonfederal Loan Dollars in 2012 Dollars, 1992-93 to 2012-13, Selected Years SOURCE: The College Board, Trends in Student Aid 2013, Figure 6.
Number of Recipients by Federal Aid Program (with Average Aid Received), 2012-13 SOURCE: The College Board, Trends in Student Aid 2013, Figure 7A.
Total Number of Undergraduate and Graduate Federal Subsidized and Unsubsidized Student Loan Borrowers and Average Amount Borrowed in 2012 Dollars, 2002-03 to 2012-13 SOURCE: The College Board, Trends in Student Aid 2013, Figure 7B.
Percentage Distribution of Federal Aid Funds by Sector, 2012-13 SOURCE: The College Board, Trends in Student Aid 2013, Figure 8A.
Total Undergraduate and Total Postsecondary FTE Enrollments by Sector, Fall 2003 to Fall 2012 SOURCE: The College Board, Trends in Student Aid 2013, page 19.
Percentage Distribution of Pell Grant Funds and Federal Subsidized and Unsubsidized Loan Funds by Sector, 2003-04 to 2012-13, Selected Years SOURCE: The College Board, Trends in Student Aid 2013, Figure 8B.
Percentage of Undergraduate Students Borrowing Federal Subsidized and Unsubsidized Loans, 2002-03, 2007-08, and 2012-13 SOURCE: The College Board, Trends in Student Aid 2013, Figure 9A.
Percentage of Undergraduate and Graduate Students Taking Private Education Loans, 2007-08 and 2011-12 SOURCE: The College Board, Trends in Student Aid 2013, Figure 9B.
Percentage of Undergraduate Students Taking Private Loans, by Sector, Family Income, and Dependency Status, 2011-12 SOURCE: The College Board, Trends in Student Aid 2013, Figure 9C.
Average Total Debt Levels of Bachelor’s Degree Recipients, Public Four-Year Colleges and Universities in 2012 Dollars, 1999-2000 to 2011-12 SOURCE: The College Board, Trends in Student Aid 2013, Figure 10A.
Average Total Debt Levels of Bachelor’s Degree Recipients, Private Nonprofit Four-Year Colleges and Universities in 2012 Dollars, 1999-2000 to 2011-12 SOURCE: The College Board, Trends in Student Aid 2013, Figure 10B.
Distribution of Outstanding Education Debt Balances, 2012 Fourth Quarter SOURCE: The College Board, Trends in Student Aid 2013, Figure 11A.
Total Outstanding Student Debt, Number of Borrowers with Outstanding Debt, and Average Balance, Relative to 2005 Fourth Quarter, 2005 to 2012 SOURCE: The College Board, Trends in Student Aid 2013, Figure 11B.
Total Amount Borrowed by 2009 by Students Beginning Postsecondary Education in 2003-04, by Degree Attainment SOURCE: The College Board, Trends in Student Aid 2013, Figure 11C.
Distribution of Outstanding Federal Direct Loan Dollars and Recipients by Repayment Plan, FY 2013 SOURCE: The College Board, Trends in Student Aid 2013, Figure 12A.
Federal Student Loan Two-Year Cohort Default Rate (CDR), 1987–2011 SOURCE: The College Board, Trends in Student Aid 2013, Figure 12B.
Distribution of Total Enrollments, 2009-10, Borrowers Entering Repayment in FY 2011, and FY 2011 Two-Year Cohort Default Rate, by Sector SOURCE: The College Board, Trends in Student Aid 2013, Figure 12C.
Number of Pell Recipients, Total Inflation-Adjusted Expenditures, and Maximum and Average Pell Grant Relative to the 1976-77 Level, 1976-77 to 2012-13 SOURCE: The College Board, Trends in Student Aid 2013, Figure 13A.
Maximum and Average Pell Grant in 2012 Dollars, 1976-77 to 2012-13 SOURCE: The College Board, Trends in Student Aid 2013, Figure 13B.
Federal Pell Grant Awards in 2012 Dollars, 1976-77 to 2012-13, Selected Years SOURCE: The College Board, Trends in Student Aid 2013, page 24.
Total Undergraduate Enrollment and Percentage of Students Receiving Pell Grants, 2002-03 to 2012-13 SOURCE: The College Board, Trends in Student Aid 2013, Figure 14A.
Inflation-Adjusted Maximum Pell Grant, Tuition and Fees (TF), Tuition and Fees and Room and Board (TFRB), and Maximum Pell Grant as a Percentage of TF and TFRB, 1993-94 to 2013-14 SOURCE: The College Board, Trends in Student Aid 2013, Figure 14B.
Distribution of Pell Grant Recipients by Dependency Status, Enrollment Intensity, and Institutional Sector, 2011-12 SOURCE: The College Board, Trends in Student Aid 2013, Figure 15A.
Distribution of Pell Grant Recipients by Dependency Status and Income Level, 2011-12 SOURCE: The College Board, Trends in Student Aid 2013, Figure 15B.
Distribution of Pell Grant Recipients and Pell Grant Dollars by Dependency Status and Enrollment Intensity, 2011-12 SOURCE: The College Board, Trends in Student Aid 2013, page 26.
Distribution of Pell Grant Recipients by Age, 2011-12 SOURCE: The College Board, Trends in Student Aid 2013, Figure 15C.
Total Education Tax Credits and Deductions in 2012 Dollars, 1998 to 2011 (and Average Tax Savings per Recipient) SOURCE: The College Board, Trends in Student Aid 2013, Figure 16A.
Distribution of Education Tax Credits by Adjusted Gross Income (AGI), 2011 (and Average Tax Savings per Recipient in 2012 Dollars) SOURCE: The College Board, Trends in Student Aid 2013, Figure 16B.
Distribution of Savings from Tuition Tax Deductions by Adjusted Gross Income (AGI), 2011 (and Average Tax Savings per Recipient in 2012 Dollars) SOURCE: The College Board, Trends in Student Aid 2013, Figure 16C.
Need-Based and Non-Need-Based State Grants per Full-Time Equivalent (FTE) Undergraduate Student in 2012 Dollars, 1971-72 to 2011-12 SOURCE: The College Board, Trends in Student Aid 2013, Figure 17A.
Percentage of Undergraduate State Grant Aid for Which Students’ Financial Circumstances Were Considered, by State, 2011-12 SOURCE: The College Board, Trends in Student Aid 2013, Figure 17B.
State Grant Aid per Full-Time Equivalent (FTE) Undergraduate Student in 2012 Dollars, 2011-12 SOURCE: The College Board, Trends in Student Aid 2013, Figure 18A.
State Grant Expenditures as a Percentage of Total State Support for Higher Education, 2011-12 SOURCE: The College Board, Trends in Student Aid 2013, Figure 18B.
Institutional Need-Based and Non-Need-Based Grant Aid, and Federal and State Grant Aid, by Dependency Status and Family Income, Full-Time Undergraduate Students at Public Four-Year Colleges and Universities, 2011-12 SOURCE: The College Board, Trends in Student Aid 2013, Figure 19.
Institutional Need-Based and Non-Need-Based Grant Aid, and Federal and State Grant Aid, by Dependency Status and Family Income, Full-Time Undergraduate Students at Private Nonprofit Four-Year Colleges and Universities, 2011-12 SOURCE: The College Board, Trends in Student Aid 2013, Figure 19.
Distribution of Full-Time Undergraduate Students at Public and Private Nonprofit Four-Year Colleges and Universities by Tuition and Fee Level, Dependency Status, and Family Income, 2007-08 SOURCE: The College Board, Trends in Student Aid 2013, page 30.
Average Institutional Grant per Full-Time Equivalent (FTE) Student: Percentage Meeting Need, Exceeding Need, Athletic Awards, and Tuition Waivers, Public Four-Year Colleges and Universities in 2012 Dollars, 2001-02 to 2012-13 SOURCE: The College Board, Trends in Student Aid 2013, Figure 20A.
Average Institutional Grant per Full-Time Equivalent (FTE) Student: Percentage Meeting Need, Exceeding Need, Athletic Awards, and Tuition Waivers, Private Nonprofit Four-Year Colleges and Universities in 2012 Dollars, 2001-02 to 2012-13 SOURCE: The College Board, Trends in Student Aid 2013, Figure 20B.