Download
1 / 43
430 likes | 578 Views
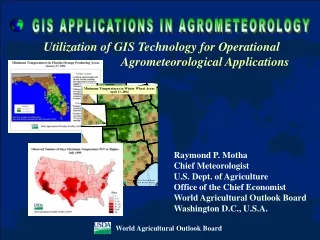
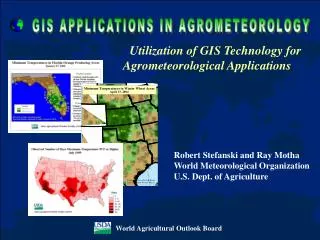
World Agricultural Outlook Board. GIS APPLICATIONS IN AGROMETEOROLOGY. Utilization of GIS Technology for Agrometeorological Applications. Robert Stefanski and Ray Motha World Meteorological Organization U.S. Dept. of Agriculture. World Agricultural Outlook Board.

E N D
WorldAgriculturalOutlookBoard GIS APPLICATIONS IN AGROMETEOROLOGY Utilization of GIS Technology for Agrometeorological Applications Robert Stefanski and Ray Motha World Meteorological Organization U.S. Dept. of Agriculture
WorldAgriculturalOutlookBoard GIS APPLICATIONS IN AGROMETEOROLOGY Introduction • Several analytical techniques are used to monitor crop weather worldwide • time series analyses • Historical analog comparisons • static maps • Depiction of ET, soil moisture • Until recently, many maps were static and depicted just one variable, making it difficult to: • overlay data sets • visualize and evaluate relationships • easily assess crop weather conditions • Geographic Information Systems (GIS) have helped overcome these hurdles
WorldAgriculturalOutlookBoard GIS APPLICATIONS IN AGROMETEOROLOGY GIS Described Simple GIS • GIS defined: method for organizing, displaying, and analyzing spatial data and their relationships using computers and compatible technologies • GIS incorporates quantitative data directly into the system, helping users: • overlay multiple data sets • create precise maps • perform spatial analyses • Numerous organizations use GIS to study, monitor, and model processes Robust GIS
WorldAgriculturalOutlookBoard GIS APPLICATIONS IN AGROMETEOROLOGY GIS Users USDA Forest Service GIS used to map wildfire burn severity and to focus efforts to minimize flooding and erosion
GIS used to map crop areas annually for selected states
GIS used to delineate field boundaries, map land use, and calculate acreages
PRISM Parameter-elevation Regressions on Independent Slopes Model • Generates gridded estimates of climatic parameters • Moving-window regression of climate vs. elevation for each grid cell • Uses nearby station observations • Spatial climate knowledge base weights stations in the regression function by their climatological similarity to the target grid cell
Station Weighting Combined weight of a station is: W = f {Wd, Wz, Wc, Wf, Wp, Wl, Wt, We} • Distance • Elevation • Clustering • Topographic Facet (orientation) • Coastal Proximity • Vertical Layer (inversion) • Topographic Index (cold air pooling) • Effective Terrain Height (orographic profile)
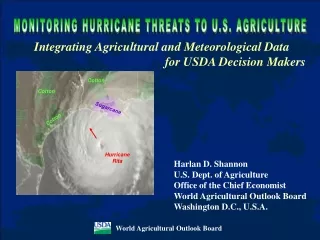
GIS APPLICATIONS IN AGROMETEOROLOGY GIS used to track tropical cyclones
GIS APPLICATIONS IN AGROMETEOROLOGY GIS used to map flooding associated with a landfalling hurricane
GIS APPLICATIONS IN AGROMETEOROLOGY WAOB GIS • Software • ArcView 3.x • ArcGIS 9.x • Hardware • 7 Pentium IV desktop computers • Processing speed 2.4 to 2.8 GHz • 512 MB RAM • Windows 2000/XP operating system • PCs connected via local area network • Oracle 9i database
GIS APPLICATIONS IN AGROMETEOROLOGY Data • U.S. National Weather Service • synoptic/cooperative observer data • WMO data important • NWS/WMO data archived in DBMS • Data describing extreme weather • tropical cyclone wind/coordinate data • mesonetwork temp./precip. data • USDA National Agricultural Statistics Service (NASS) crop production, yield, and area data • NASS weekly crop progress/condition data
GIS APPLICATIONS IN AGROMETEOROLOGY USDA Agrometeorological GIS Applications • WAOB GIS regularly used to create a variety of agricultural weather analyses • Products grouped into three categories: • Manual, single-parameter applications • Automated, single-parameter applications • Manual, multiple-parameter applications
GIS APPLICATIONS IN AGROMETEOROLOGY Manual, Single-Parameter Applications • Refer to those WAOB products that map one agricultural or meteorological parameter and are generally labor-intensive to create • Created by manually converting raw data into GIS-compatible formats and then using a GUI to import and display these data in the GIS • GUI also used to add text and legends to the crop and weather maps, and thus create the finished products
GIS APPLICATIONS IN AGROMETEOROLOGY Crop Production Data – Internet U.S. Corn
GIS APPLICATIONS IN AGROMETEOROLOGY Crop Production Data – Excel U.S. Corn
GIS APPLICATIONS IN AGROMETEOROLOGY Crop Production Data – ArcView U.S. Corn
Weather Analyses – Text File Text file, comma-delimited WMO data Note latitude/longitude data in addition to weather data
GIS APPLICATIONS IN AGROMETEOROLOGY Automated, Single-Parameter Applications • Similar to manual, single-parameter applications in that one agricultural or meteorological parameter is displayed and analyzed on each map, however, the process for creating these products has been automated • Product creation process can be time consuming and tedious if a large number of products are desired and these products are created manually • Automation significantly reduces the time and labor required to produce these products
WorldAgriculturalOutlookBoard GIS APPLICATIONS IN AGROMETEOROLOGY Avenue Scripts • Object-oriented programming language, enables users to automate various tasks associated with mapping • Examples of automation: • loading data • spatial analysis (e.g., contouring) • defining map scale/extent • annotation • creating a map legend • exporting/printing a map
WorldAgriculturalOutlookBoard GIS APPLICATIONS IN AGROMETEOROLOGY Daily Plot Maps Green number = precipitation Red number = maximum temperature Blue number = minimum temperature Empty, partially filled, and completely filled green circles symbolize precipitation amounts
WorldAgriculturalOutlookBoard GIS APPLICATIONS IN AGROMETEOROLOGY Manual, Multiple-Parameter Applications • Refer to those WAOB products that map two or more agrometeorological parameters and are generally labor-intensive to create • Demonstrate the significant overlay capabilities of GIS, specifically the ability to visualize – and quantify – the percent of agriculture affected by various types of weather • Often typify the special crop weather assessments prepared by WAOB meteorologists in response to extreme or severe weather
WorldAgriculturalOutlookBoard GIS APPLICATIONS IN AGROMETEOROLOGY U.S. Drought Monitor – Background • In 1999, government and university scientists began working together to produce the U.S. Drought Monitor (USDM), a weekly product designed to provide a single snapshot of the spatial extent and intensity of drought in U.S. • Drought experts from four agencies are responsible for coordinating USDM production each week • On a rotating basis, an individual from one of these agencies serves as product author for the week, and typically authors the product for 2 weeks.
WorldAgriculturalOutlookBoard GIS APPLICATIONS IN AGROMETEOROLOGY U.S. Drought Monitor - Methodology • Each Monday, author consults data from numerous sources • quantitative observational networks • model output • satellite and radar imagery • subjective reports • Author uses these data to prepare a first draft of the USDM for that week • Draft distributed via email list-server to approximately 150 people, including fellow authors and climate and water experts from around the country. FINAL 1st draft 2nd draft 3rd draft FINAL 1st draft 2nd draft 3rd draft FINAL 1st draft 2nd draft 3rd draft FINAL 1st draft 2nd draft 3rd draft
WorldAgriculturalOutlookBoard GIS APPLICATIONS IN AGROMETEOROLOGY U.S. Drought Monitor - Methodology • Members of drought list provide author feedback, used to refine USDM • Through iterative process, author prepares and distributes 2-3 drafts of the USDM during Monday, Tuesday, and Wednesday of each week to obtain the best product possible. • Final product and an accompanying text summary posted every Thursday at 0830 LT on the USDM web site: (http://www.drought.unl.edu/dm/monitor.html)
WorldAgriculturalOutlookBoard GIS APPLICATIONS IN AGROMETEOROLOGY U.S. Drought Monitor - Software • Originally prepared using CorelDraw • unable to overlay indices • quantitative analysis not possible • USDM authors switched to ArcGIS • Authors obtained professional training • draw drought areas • annotate map • print/export product • Initial difficulties using GIS blamed on • author inexperience • deadlines limiting troubleshooting time