Algorithm & Flow Charts
Algorithm & Flow Charts. Presented By Manesh T Course:1090 CS. ALGORITHMS AND FLOWCHARTS. Algorithm Step by step method to solve a problem is algorithm Flow Chart Diagrammatic representation of algorithm. Algorithm. Example 1: Write an algorithm to Add two numbers.

Algorithm & Flow Charts
E N D
Presentation Transcript
Algorithm & Flow Charts Presented ByManesh TCourse:1090 CS
ALGORITHMS AND FLOWCHARTS • Algorithm • Step by step method to solve a problem is algorithm • Flow Chart • Diagrammatic representation of algorithm
Algorithm • Example 1: Write an algorithm to Add two numbers
Problem: Add two numbers Step 1: Start Step 2: Read A, B Step 3: C=A+B Step 4: Print C Step 5: Stop
Algorithm Problem: Multiply 2 numbers Problem: Subtract 2 numbers Step 1: Start Step 2: Read A, B Step 3: C=A-B Step 4: Print C Step 5: Stop Step 1: Start Step 2: Read A, B Step 3: C=A*B Step 4: Print C Step 5: Stop
AlgorithmProblem: Average of 3 numbers Step 1: Start Step 2: Read A, B, C Step 3: Avg=(A+B+C)/3 Step 4: Print Avg Step 5: Stop
AlgorithmProblem: Find even or odd Step 1: Start Step 2: Read N Step 3: Is (N%2=0) then Print “Even” else Print “Odd” Step 4: Stop
AlgorithmProblem: Find Pass or Fail • Detailed Algorithm • Step 1: Start • Step 2: Read M1,M2,M3,M4 Step 3: GRADE M1+M2+M3+M4 Step 4: Is (GRADE < 60) then Print “FAIL” else Print “PASS” Step 5: Stop
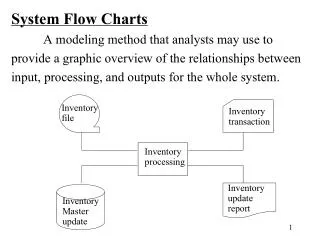
The Flowchart A Flowchart is another algorithm but graphical. • shows logic solution • emphasizes individual steps and their interconnections • A flowchart must have a start and stop • A steps in a flowchart must connect.
Flowchart Symbols General Used Symbols
Flow Chart: Add Two Numbers Algorithm Start Flowchart Read A, B C=A+B Print C Stop
DECISION STRUCTURES • The expression A>B is a logical expression • it describes a condition we want to test • if A>B is true (if A is greater than B) we take the action on left • print the value of A • if A>B is false (if A is not greater than B) we take the action on right • print the value of B
is A>B Y N DECISION STRUCTURES Print A Print B
Flow Chart: Find Even or Odd Start Read N Is N%2=0 N Y Print “Odd” Print “Even” Stop
Flow Chart: Find Largest of two numbers Start Read A, B Is A>B N Y Print “B is large” Print “A is large” Stop
START Read a, b, c d sqrt(b x b – 4 x a x c) x1(–b + d) / (2 x a) X2 (–b – d) / (2 x a) STOP Problem: Write Algorithm and Flowchart to find solution of Quadratic equation • Algorithm: • Step 1: Start • Step 2: Read a, b, c • Step 3: dsqrt ( ) • Step 4: x1 (–b + d) / (2 x a) • Step 5: x2 (–b – d) / (2 x a) • Step 6: Print x1, x2 • Step 7: Stop Print X1, X2
Assignment 1 Draw algorithm and flowchart • Find area of triangle (area=length*breadth*height) • Convert Celsius to Fahrenheit temperature (C=1/32*(F-32) • Find Area of Circle (area= 3.14*R*R) • Find volume of sphere (4/3* 3.14*R*R*R) • Find area of rectangle (area= length *breadth)